Remove business-intelligence-and-visualization
article thumbnail

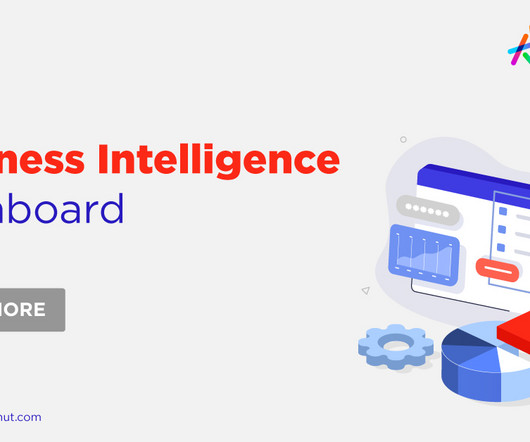
Business Intelligence Dashboard: All You Need to Know

Knowledge Hut

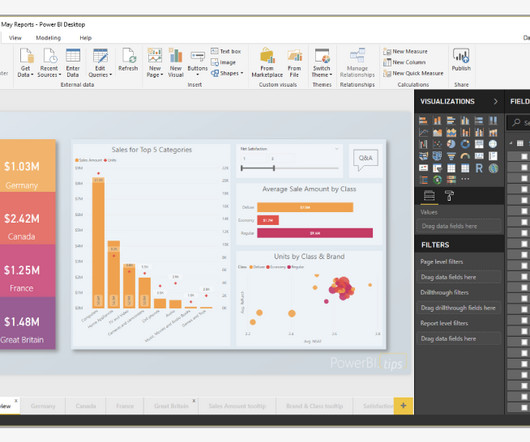
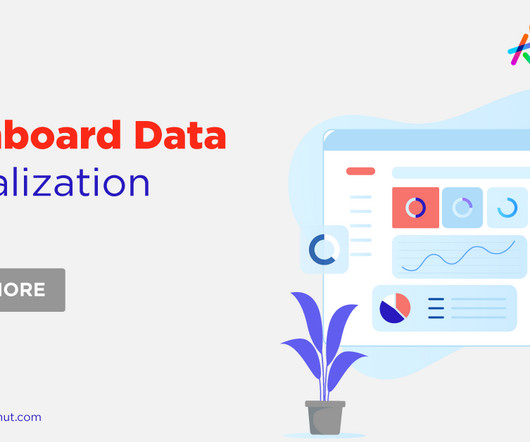
Communication strategies are evolving, and in today's technologically advanced world, success is strongly correlated with the volume rather than the quality of one's information — metrics about the business, the client, the rival, and the market. What is a Business Intelligence Dashboard?

article thumbnail

Future of Business Intelligence: Top Trends to Watch

Knowledge Hut

Have you ever used business intelligence (BI) to drive better business decisions for better revenue? If you are unaware of the future of Business Intelligence, this is the best platform for you. Data plays a crucial role in identifying opportunities for growth and decision-making in today's business landscape.

Insiders

Sign Up for our Newsletter

This site is protected by reCAPTCHA and the Google Privacy Policy and Terms of Service apply.

article thumbnail

Differences Between Business Intelligence vs Data Science

Knowledge Hut

Data Science and Business intelligence are popular terms in every business domain these days. For an organization, it is essential to know the difference between business intelligence and data science to make fair use of both and ensure significant growth. Business Intelligence only deals with structured data.

article thumbnail

How does ChatGPT work? As explained by the ChatGPT team.

The Pragmatic Engineer

OpenAI is the creator of ChatGPT, which is just one of the business’ products. OpenAI itself was founded in 2015 and at the company’s core today is still a research lab with the  goal  of creating a safe and aligned artificial general intelligence (AGI.) Let’s visualize these steps.

article thumbnail

New Study: 2018 State of Embedded Analytics Report

Why do some embedded analytics projects succeed while others fail? We surveyed 500+ application teams embedding analytics to find out which analytics features actually move the needle. Read the 6th annual State of Embedded Analytics Report to discover new best practices. Brought to you by Logi Analytics.

article thumbnail

Power BI vs Tableau: Which Data Visualization Tool is Right for You?

Knowledge Hut

Step into the realm of data visualization with a comprehensive exploration of Power BI and Tableau. If you are an expert in working with data or a beginner excited to use visualization, this blog will help you understand the differences between power bi and tableau. Power BI takes advantage of Microsoft's business analytics.

BI 97
article thumbnail

Major Benefits of Power BI you Should Know in 2024

Knowledge Hut

Power BI is a technology-driven business intelligence tool or an array of software services, apps, and connectors to convert unrelated and raw data into visually immersive, coherent, actionable, and interactive insights and information. Later, it was renamed Power BI and presented as Power BI for Office 365 in September 2013.

BI 89
article thumbnail

Monetizing Analytics Features: Why Data Visualizations Will Never Be Enough

Think your customers will pay more for data visualizations in your application? But today, dashboards and visualizations have become table stakes. Five years ago they may have. Discover which features will differentiate your application and maximize the ROI of your embedded analytics. Brought to you by Logi Analytics.

article thumbnail

5 Early Indicators Your Embedded Analytics Will Fail

Many application teams leave embedded analytics to languish until something—an unhappy customer, plummeting revenue, a spike in customer churn—demands change. But by then, it may be too late. In this White Paper, Logi Analytics has identified 5 tell-tale signs your project is moving from “nice to have” to “needed yesterday.".