Remove product visualize
article thumbnail

What is Power BI Used For - Practical Applications Of Power BI

Knowledge Hut

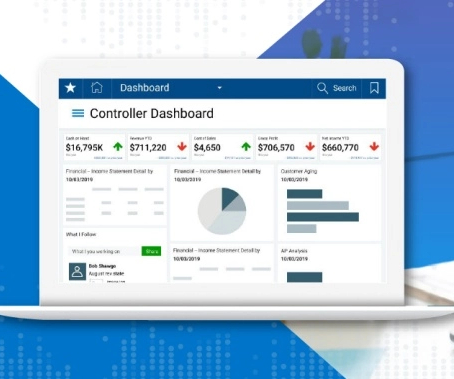
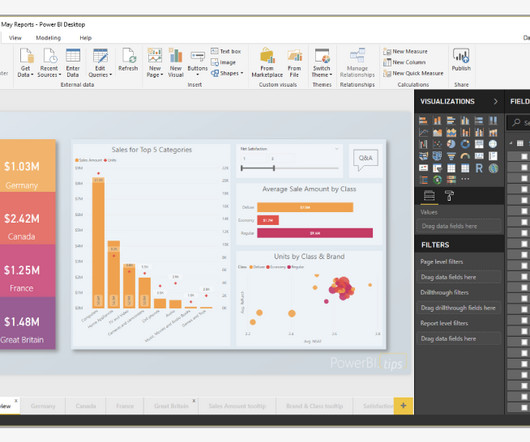
Practical Uses of Power BI Microsoft Power BI will help you solve this problem with the help of a powerful business intelligence tool that mainly stresses on Visualization. Visualization - Inbuilt Feature Data Visualization is very crucial for human management in business systems.

BI 94
article thumbnail

Building Linked Data Products With JSON-LD

Data Engineering Podcast

In this episode Brian Platz explains how JSON-LD can be used as a shared representation of linked data for building semantic data products. Get all of the details and try the new product today at dataengineeringpodcast.com/rudderstack You shouldn't have to throw away the database to build with fast-changing data.

Building 189
Insiders

Sign Up for our Newsletter

This site is protected by reCAPTCHA and the Google Privacy Policy and Terms of Service apply.

article thumbnail

How does ChatGPT work? As explained by the ChatGPT team.

The Pragmatic Engineer

OpenAI is the creator of ChatGPT, which is just one of the business’ products. The engineering, product, and design organization that makes and scales these products is called "Applied," and was founded in 2020 when GPT-3 was released. Let’s visualize these steps.

article thumbnail

A Notebook is all I want or Don't

Data Engineering Weekly

People have reservations about using tools like Jupytor Notebook for the production pipeline for a good reason. Let’s take a few common criticisms about running Notebook in production. Dependency management is also bound to the individual scope of the Notebook and prevents production-grade code quality.

article thumbnail

How to Build Data Experiences for End Users

Organizational data literacy is regularly addressed, but it’s uncommon for product managers to consider users’ data literacy levels when building products. Product managers need to research and recognize their end users' data literacy when building an application with analytic features.

article thumbnail

How Microsoft does Quality Assurance (QA)

The Pragmatic Engineer

T The SDET enables the test team with the tools and processes that need to be in place for the testers to do what they do best… test the living daylights out of the product and find as many bugs as possible before it goes to the market. Now, we no longer had to wait days for feedback before shipping code to production.

article thumbnail

Powering Vector Search With Real Time And Incremental Vector Indexes

Data Engineering Podcast

Get all of the details and try the new product today at dataengineeringpodcast.com/rudderstack This episode is brought to you by Datafold – a testing automation platform for data engineers that finds data quality issues before the code and data are deployed to production. With Materialize, you can! Hex brings everything together.

BI 147
article thumbnail

The Definitive Guide to Dashboard Design

Dashboard design can mean the difference between users excitedly embracing your product or ignoring it altogether. Great dashboards lead to richer user experiences and significant return on investment (ROI), while poorly designed dashboards distract users, suppress adoption, and can even tarnish your project or brand.

article thumbnail

Monetizing Analytics Features: Why Data Visualizations Will Never Be Enough

Think your customers will pay more for data visualizations in your application? But today, dashboards and visualizations have become table stakes. Five years ago they may have. Discover which features will differentiate your application and maximize the ROI of your embedded analytics. Brought to you by Logi Analytics.

article thumbnail

New Study: 2018 State of Embedded Analytics Report

Why do some embedded analytics projects succeed while others fail? We surveyed 500+ application teams embedding analytics to find out which analytics features actually move the needle. Read the 6th annual State of Embedded Analytics Report to discover new best practices. Brought to you by Logi Analytics.

article thumbnail

5 Early Indicators Your Embedded Analytics Will Fail

Many application teams leave embedded analytics to languish until something—an unhappy customer, plummeting revenue, a spike in customer churn—demands change. But by then, it may be too late. In this White Paper, Logi Analytics has identified 5 tell-tale signs your project is moving from “nice to have” to “needed yesterday.".