article thumbnail

What is Power BI Used For - Practical Applications Of Power BI

Knowledge Hut

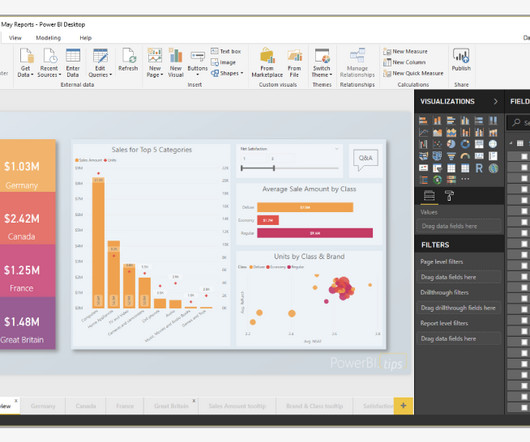
But in case you are not able to access or connect with that important data, you are not yielding anything. Practical Uses of Power BI Microsoft Power BI will help you solve this problem with the help of a powerful business intelligence tool that mainly stresses on Visualization.

BI 98
article thumbnail

Top Features of Power BI

Knowledge Hut

Power BI is a business analytics service by Microsoft that provides users with Data Visualization and Business Intelligence tools with an elementary interface, simple for end-users so that they create reports and dashboards of their own. Microsoft Power BI Course helps to find insights within the data of an organisation.

BI 52
Insiders

Sign Up for our Newsletter

This site is protected by reCAPTCHA and the Google Privacy Policy and Terms of Service apply.

article thumbnail

Major Benefits of Power BI you Should Know in 2024

Knowledge Hut

Power BI, originally called Project Crescent, was launched in July 2011, bundled with SQL Server. Later, it was renamed Power BI and presented as Power BI for Office 365 in September 2013. The Windows Store has Power BI Desktop, which Windows 10 users can get from. What is Power BI? Meijer connected Power BI.

BI 98
article thumbnail

Guided Navigation in Power BI

FreshBI

This is where Guided Navigation in Power BI offers a method for surfacing the stories that your dashboards are intended to tell. From a technical POV, we’re using a combination of two concepts in Power BI: 1) Transparent Shapes AND 2) Bookmarks. And we do it using these easy steps…. 5) Create another bookmark with the blur shapes off.

BI 52
article thumbnail

How Embedded Analytics Gets You to Market Faster with a SAAS Offering

Customers expect rapid value from your product (time-to-value), data security, and access to advanced capabilities. Traditional Business Intelligence (BI) tools can provide valuable data analysis capabilities, but they have a barrier to entry that can stop small and midsize businesses from capitalizing on them.

article thumbnail

Power BI vs Tableau: Which Data Visualization Tool is Right for You?

Knowledge Hut

Step into the realm of data visualization with a comprehensive exploration of Power BI and Tableau. In a world where data is important, deciding between power bi vs tableau can change your path in analyzing things. We are talking about tableau vs power bi market share using features, interfaces and performance.

BI 98
article thumbnail

Simplifying BI pipelines with Snowflake dynamic tables

ThoughtSpot

While AI-powered, self-service BI platforms like ThoughtSpot can fully operationalize insights at scale by delivering visual data exploration and discovery, it still requires robust underlying data management. Snowflake's new dynamic tables feature redefines how BI and analytics teams approach data transformation pipelines.

BI 94
article thumbnail

Monetizing Analytics Features: Why Data Visualizations Will Never Be Enough

Think your customers will pay more for data visualizations in your application? Five years ago they may have. But today, dashboards and visualizations have become table stakes. Discover which features will differentiate your application and maximize the ROI of your embedded analytics. Brought to you by Logi Analytics.

article thumbnail

5 Early Indicators Your Embedded Analytics Will Fail

Many application teams leave embedded analytics to languish until something—an unhappy customer, plummeting revenue, a spike in customer churn—demands change. But by then, it may be too late. In this White Paper, Logi Analytics has identified 5 tell-tale signs your project is moving from “nice to have” to “needed yesterday.".