Improving Business Ecosystem and Customer Satisfaction with Preset Cloud and Embedded Dashboards
Preset
MAY 10, 2023
Learn how a high-growth security and identity verification company uses Preset to accelerate its growth and customer service.

 embedded-dashboards
Preset
MAY 10, 2023
Learn how a high-growth security and identity verification company uses Preset to accelerate its growth and customer service.

Christophe Blefari
APRIL 19, 2024
Snowflake text embeddings for retrieval. Distributed dashboarding with DuckDB WASM — Ramon put words into ideas I have in my mind for months: distributed dashboarding. Winnie developed a great tool to save time in documenting you dbt projects using Gen AI models.
This site is protected by reCAPTCHA and the Google Privacy Policy and Terms of Service apply.
Knowledge Hut
MAY 3, 2024
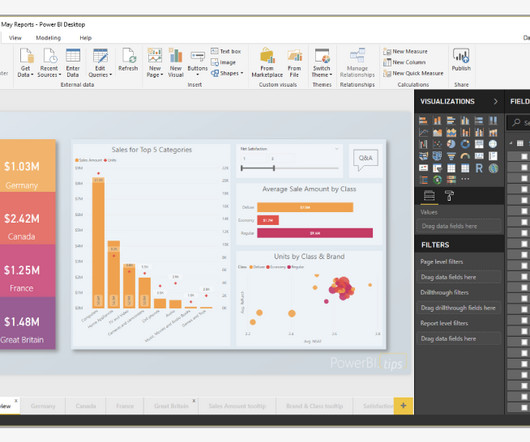
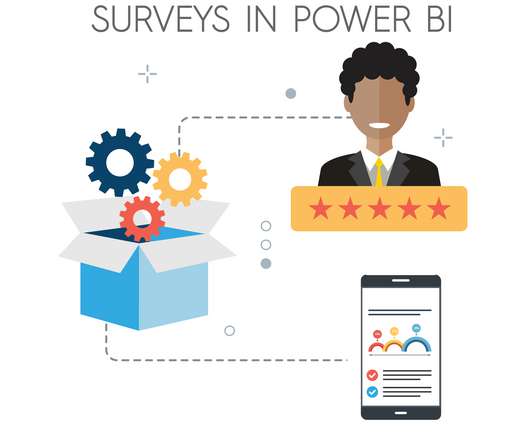
Power BI is a business analytics service by Microsoft that provides users with Data Visualization and Business Intelligence tools with an elementary interface, simple for end-users so that they create reports and dashboards of their own. Print Dashboard: Power BI allows printing of dashboards, which is a new feature.

Simon Späti
SEPTEMBER 29, 2022
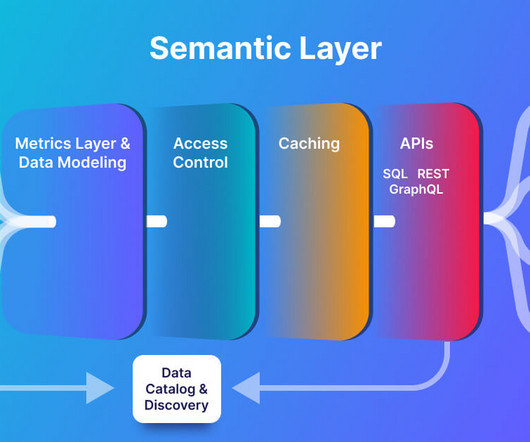
We build dashboards with yearly and monthly aggregations. What has changed is that we no longer use a singular business intelligence tool; different teams use different visualizations (BI, notebooks, and embedded analytics). A semantic layer is something we use every day.

Advertisement
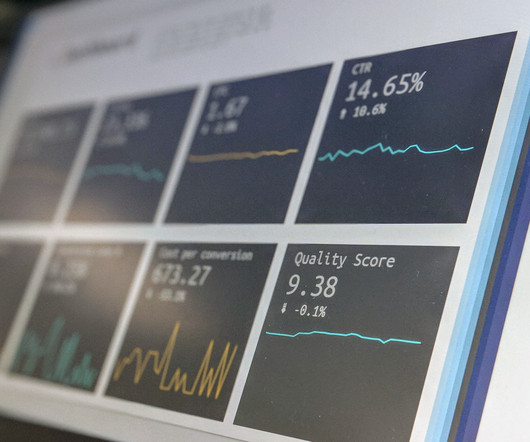
When your customers come to your app, what do they see: clunky, outdated dashboards or a sleek, modern interface? If your embedded analytics are looking stale, leverage these free graphics libraries to take your embedded analytics offerings above and beyond.
Simon Späti
SEPTEMBER 29, 2022
We build dashboards with yearly and monthly aggregations. What has changed is that we no longer use a singular business intelligence tool; different teams use different visualizations (BI, notebooks, and embedded analytics). A semantic layer is something we use every day.
Knowledge Hut
DECEMBER 22, 2023
The core Power BI benefits lie in helping businesses make data-driven decisions through interactive dashboards and Business Intelligence reports. Options for producing powerful models and visualizations make the advantages of the Power BI dashboard almost limitless. The Components and Features of Power BI Components of Power BI 1.
Advertisement
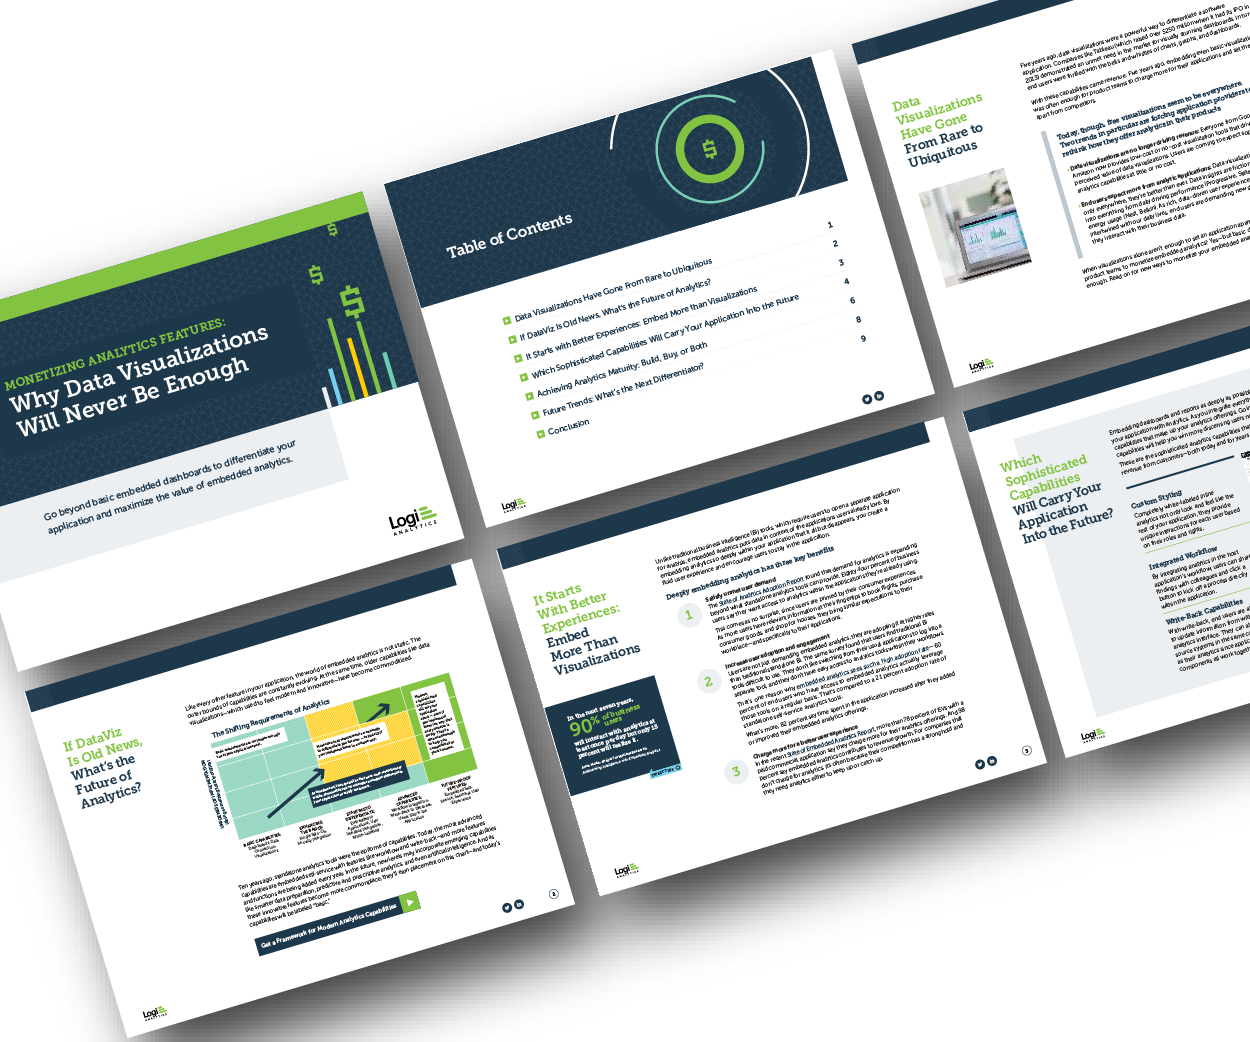
But today, dashboards and visualizations have become table stakes. Discover which features will differentiate your application and maximize the ROI of your embedded analytics. Think your customers will pay more for data visualizations in your application? Five years ago they may have. Brought to you by Logi Analytics.

Advertisement
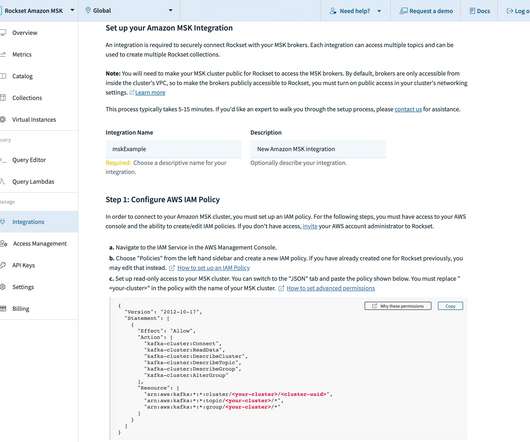
Start-ups & SMBs launching products quickly must bundle dashboards, reports, & self-service analytics into apps. Embedded analytics offers a strategic solution to this challenge. Challenges like infrastructure costs, safety concerns, as well as uptime and scaling can all be avoided with the right embedded analytics technology.

Advertisement
Organizations look to embedded analytics to provide greater self-service for users, introduce AI capabilities, offer better insight into data, and provide customizable dashboards that present data in a visually pleasing, easy-to-access format.

Advertisement
In its 2020 Embedded BI Market Study, Dresner Advisory Services continues to identify the importance of embedded analytics in technologies and initiatives strategic to business intelligence. Discover the top seven requirements to consider when evaluating your embedded dashboards and reports.

Advertisement
But today, dashboards and visualizations have become commonplace. Turning embedded analytics into a source of revenue means integrating advanced features in unique, hard-to-steal ways. Discover which features will differentiate your application and maximize the ROI of your embedded analytics.

Advertisement
Every data-driven project calls for a review of your data architecture—and that includes embedded analytics. Before you add new dashboards and reports to your application, you need to evaluate your data architecture with analytics in mind. Download the whitepaper to learn about a Modern Data Architecture for Embedded Analytics.
Advertisement
Embedding analytics in software presents some unique opportunities—and poses unique challenges—to software teams. What are best practices when designing the UI and UX of embedded dashboards, reports, and analytics? What should software teams know about implementing security that works with the rest of their products?
Advertisement
Embedding dashboards, reports and analytics in your application presents unique opportunities and poses unique challenges. We interviewed 16 experts across business intelligence, UI/UX, security and more to find out what it takes to build an application with analytics at its core.

Expert insights. Personalized for you.


Let's personalize your content