Remove Data Collection Remove Non-relational Database Remove Relational Database Remove Structured Data
article thumbnail

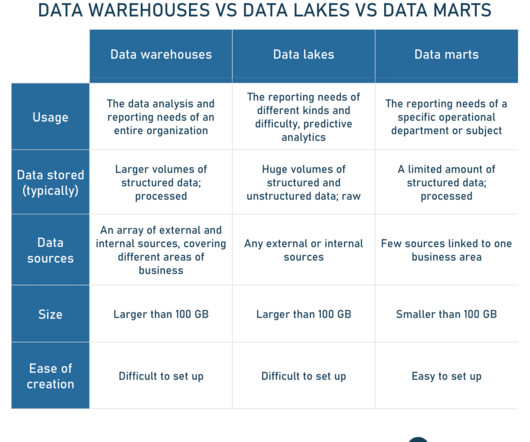
Best Morgan Stanley Data Engineer Interview Questions

U-Next

Introduction Data Engineer is responsible for managing the flow of data to be used to make better business decisions. A solid understanding of relational databases and SQL language is a must-have skill, as an ability to manipulate large amounts of data effectively. What is a data warehouse?

article thumbnail

Data Collection for Machine Learning: Steps, Methods, and Best Practices

AltexSoft

While today’s world abounds with data, gathering valuable information presents a lot of organizational and technical challenges, which we are going to address in this article. We’ll particularly explore data collection approaches and tools for analytics and machine learning projects. What is data collection?

Insiders

Sign Up for our Newsletter

This site is protected by reCAPTCHA and the Google Privacy Policy and Terms of Service apply.

article thumbnail

100+ Big Data Interview Questions and Answers 2023

ProjectPro

Big Data is a collection of large and complex semi-structured and unstructured data sets that have the potential to deliver actionable insights using traditional data management tools. Big data operations require specialized tools and techniques since a relational database cannot manage such a large amount of data.

article thumbnail

100+ Data Engineer Interview Questions and Answers for 2023

ProjectPro

Data Engineer Interview Questions on Big Data Any organization that relies on data must perform big data engineering to stand out from the crowd. But data collection, storage, and large-scale data processing are only the first steps in the complex process of big data analysis.

article thumbnail

10 Best Big Data Books in 2024 [Beginners and Advanced]

Knowledge Hut

After carefully exploring what we mean when we say "big data," the book explores each phase of the big data lifecycle. With Tableau, which focuses on big data visualization , you can create scatter plots, histograms, bar, line, and pie charts.