


How to Build Scalable Data and AI Industrial IoT Solutions in Manufacturing
This is a collaborative post between Bala Amavasai of Databricks and Tredence, a Databricks consulting partner. We thank Vamsi Krishna Bhupasamudram, Director –...
Data engineers rely on math and statistics to coax insights out of complex, noisy data. Among the most important domains is calculus, which gives us integrals, most commonly described as calculating the area under a curve. This is useful for engineers as many data that express a rate can be integrated to produce a useful measurement. For example:
Of course, at some point most students learn how to calculate integrals, and the computation itself is simple on batch, static data. However, there are common engineering patterns that require low-latency, incremental computation of integrals to realize business value, such as setting alerts based on equipment performance thresholds or detecting anomalies in logistics use-cases.
| Point-in-time Measurement: | Integral used to calculate: | Low-Latency Business Use-case & Value |
|---|---|---|
| Windspeed | Time-Weighted Average | Shutdown sensitive equipment at operating thresholds for cost avoidance |
| Velocity | Distance | Anticipate logistics delays to alert customers |
| Transfer Rate | Total Volume Transferred | Detect network bandwidth issues or anomalous activities |
Calculating integrals is an important tool in a toolbelt for modern data engineers working on real-world sensor data. These are just a few examples, and while the techniques described below can be adapted to many data engineering pipelines, the remainder of this blog will focus on calculating streaming integrals on real-world sensor data to derive time-weighted averages.
A common pattern when working with sensor data is actually an overabundance of data: transmitting at 60 hertz, a temperature sensor on a wind turbine generates over 5 million data points per day. Multiply that by 100 sensors per turbine and a single piece of equipment might produce multiple GB of data per day. Also consider that for most physical processes, each reading is most likely nearly identical to the previous reading.
While storing this is cheap, transmitting it may not be, and many IoT production systems today have methods to distill this deluge of data. Many sensors, or their intermediate systems, are set up to only transmit a reading when something "interesting" happens, such as changing from one binary state to another or measurements that are 5% different than the last. Therefore, for the data engineer, the absence of new readings can be significant in itself (nothing has changed in the system), or might represent late arriving data due to a network outage in the field.
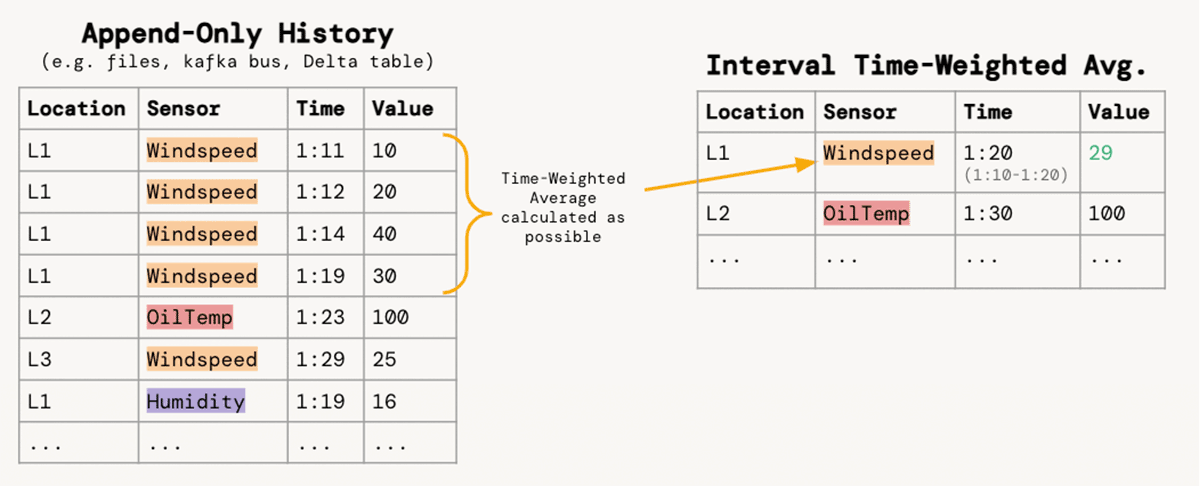
For teams of service engineers who are responsible for analyzing and preventing equipment failure, the ability to derive timely insight is dependent on the data engineers who turn massive quantities of sensor data into usable analysis tables. We will focus on the requirement to aggregate a narrow, append-only stream of sensor readings into 10-min intervals for each location/sensor pair with the time-weighted average of values:
Put simply, an integral is the area under a curve. While there are robust mathematical techniques to approximate an equation then symbolically calculate the integral for any curve, for the purposes of real-time streaming data we will rely on a numerical approximation using Riemann sums as they can be more efficiently computed as data arrive over time. For an illustration of why the application of integrals is important, consider the example below:
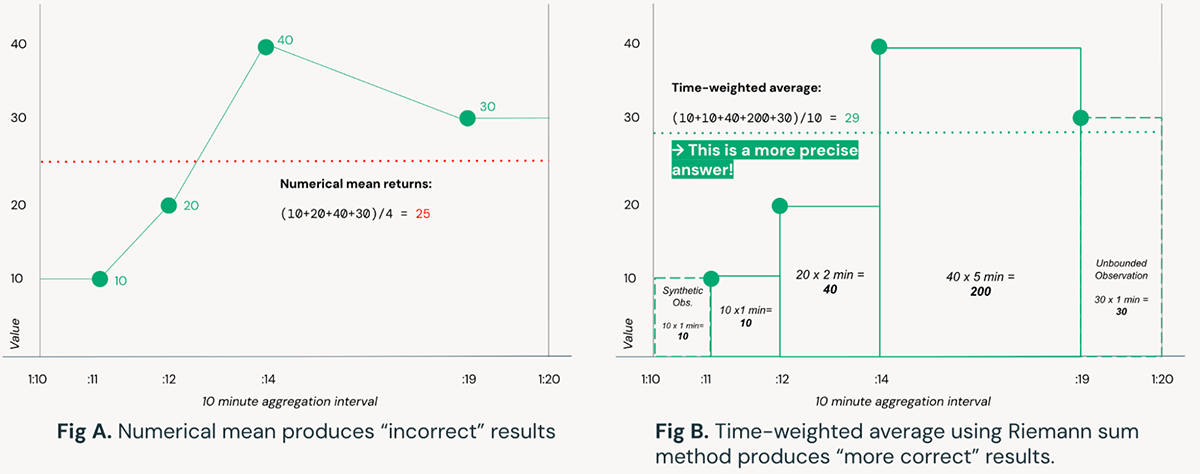
Figure A relies on simple numerical means to compute the average of a sensor reading over a time interval. In contrast, Figure B uses a Riemann sum approach to calculate time-weighted averages, resulting in a more precise answer; this could be extended further with trapezoids (Trapezoidal rule) instead of rectangles. Consider that the result produced by the naive method in Figure A is over 10% different than the method in Figure B, which in complex systems such as wind turbines may be the difference between steady-state operations and equipment failure.
For a large American utility company, this pattern was implemented as part of an end-to-end solution to turn high-volume turbine data into actionable insights for preventive maintenance and other proprietary use-cases. The below diagram illustrates the transformations of raw turbine data ingested from hundreds of machines, through ingestion from cloud storage, to high-performance streaming pipelines orchestrated with Delta Live Tables, to user-facing tables and views:
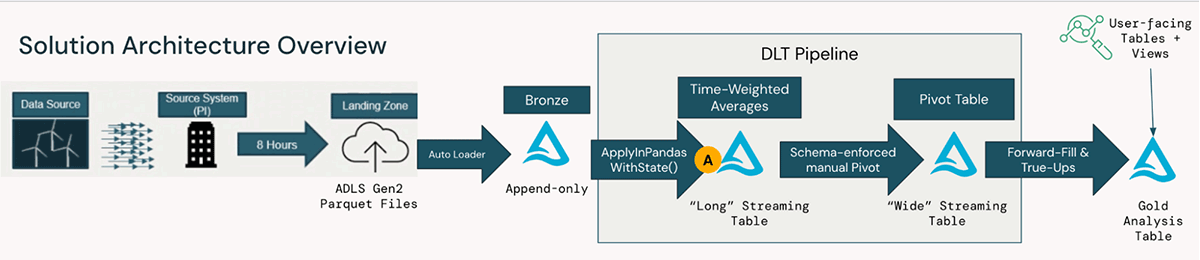
The code samples (see delta-live-tables-notebooks github) focus on the transformation step A labeled above, specifically ApplyInPandasWithState() for stateful time-weighted average computation. The remainder of the solution, including working with other software tools that handle IoT data such as Pi Historians, is simple to implement with the open-source standards and flexibility of the Databricks Data Intelligence Platform.
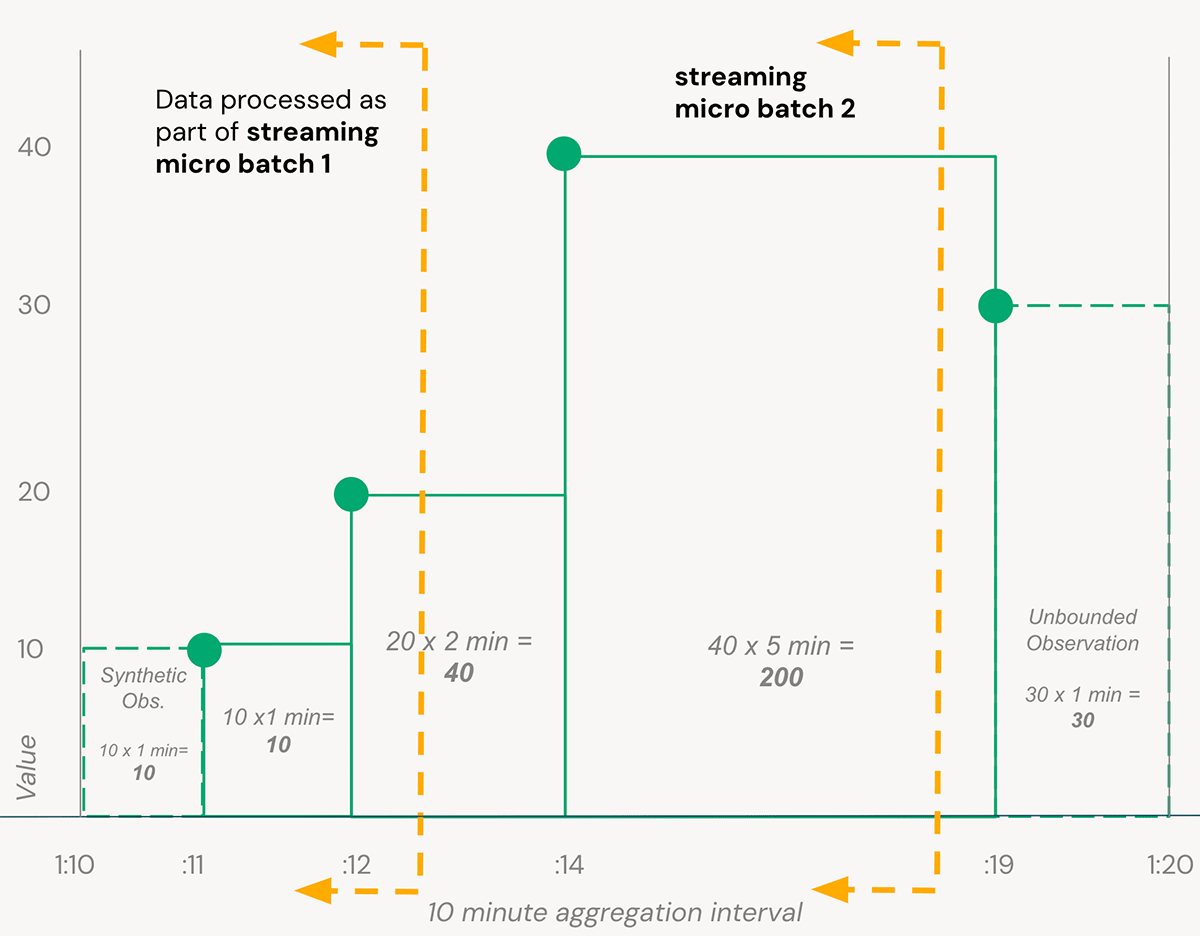
We can now carry forward the simple example from Figure B in the Integrals Refresher section above: to process data quickly from our turbine sensors, a solution must consider data as it arrives as part of a stream. In this example, we want to compute aggregates over a 10 minute window for each turbine+sensor combination. As data is arriving continuously and a pipeline processes micro batches of data as they are available, we must keep track of the state of each aggregation window until the point we can consider that time interval complete (controlled with Structured Streaming Watermarks).
Implementing this in Delta Live Tables (DLT), the Databricks declarative ETL framework, allows us to focus on the transformation logic rather than operational issues like stream checkpoints and compute optimization. See the example repo for full code samples, but here's how we use Spark's ApplyInPandasWithState() function to efficiently compute stateful time-weighted averages in a DLT pipeline:
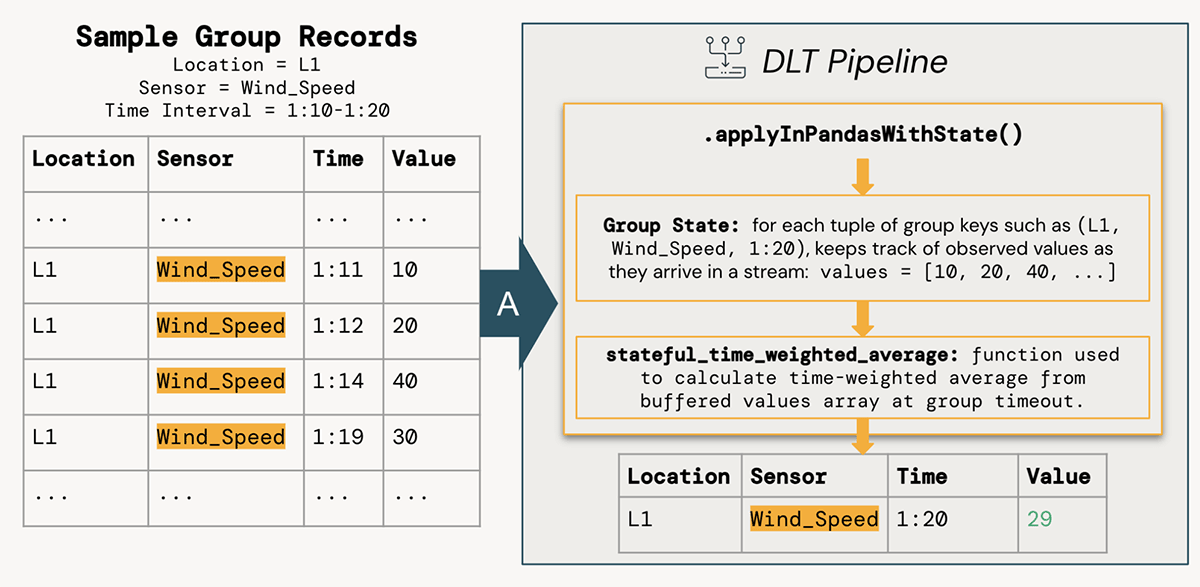
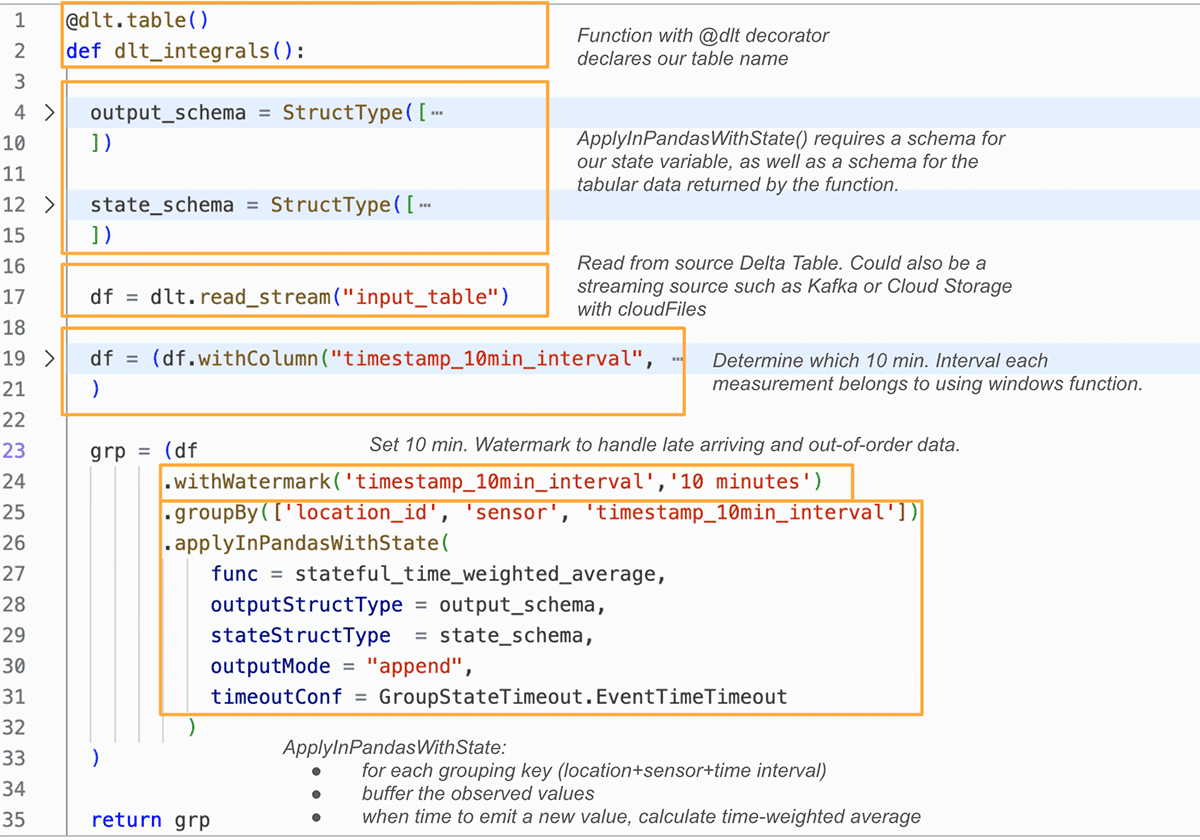
In the groupBy().applyInPandasWithState() pipelining above, we use a simple Pandas function named stateful_time_weighted_average to compute time-weighted averages. This function effectively "buffers" observed values for each state group until that group can be "closed" when the stream has seen sufficiently later timestamp values (controlled by the watermark). These buffered values are then passed through a simple Python function to compute Rieman sums.
The benefit of this approach is the ability to write a robust, testable function that operates on a single Pandas DataFrame, but can be computed in parallel across all workers in a Spark cluster on thousands of state groups simultaneously. The ability to keep track of state and determine when to emit the row for each location+sensor+time interval group is handled with the timeoutConf setting and use of the state.hasTimedOut method within the function.
The associated code for this blog walks through the setup of this logic in a Delta Live Tables pipeline with sample data, and is runnable in any Databricks workspace.
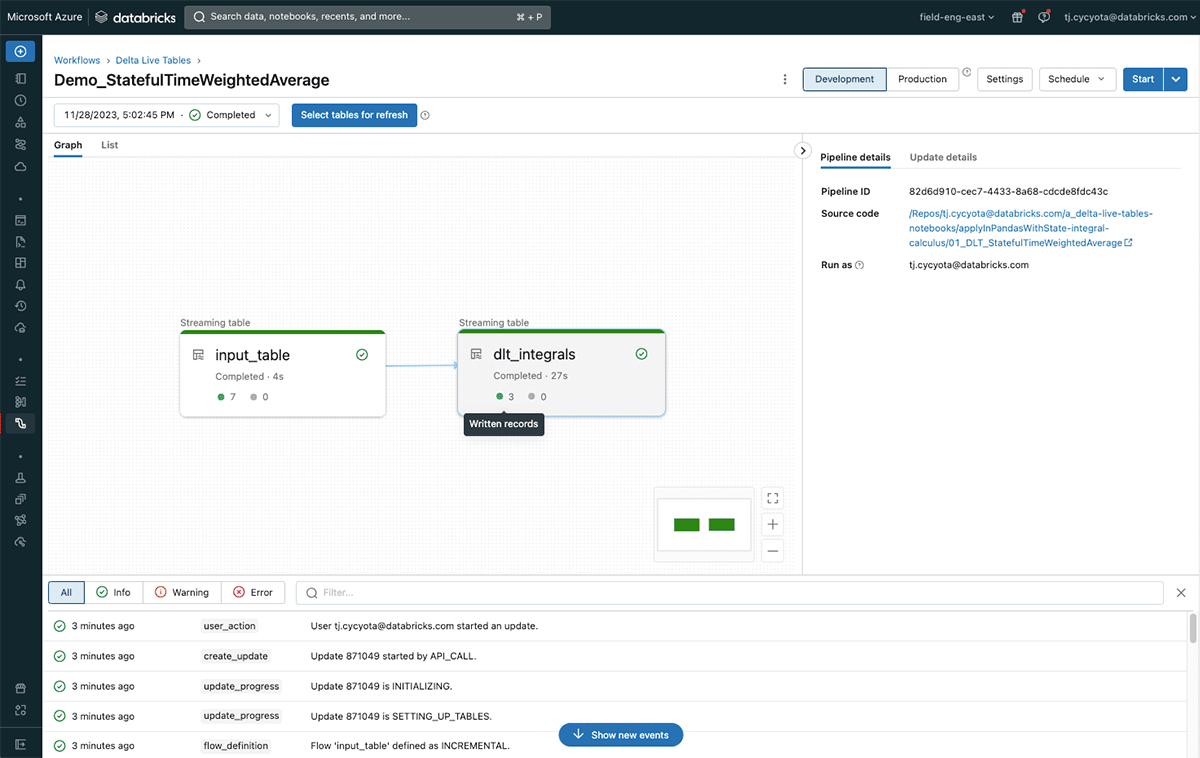
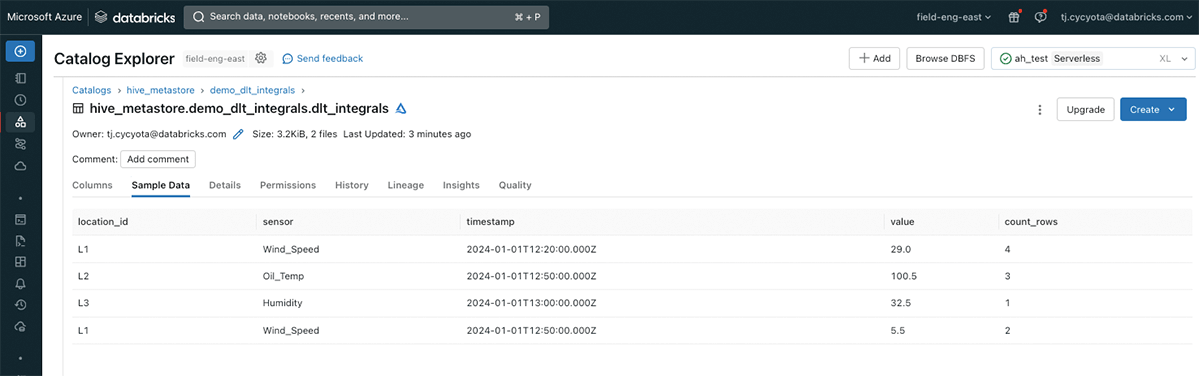
The results demonstrate that it is possible to efficiently and incrementally compute integral-based metrics such as time-weighted averages on high-volume streaming data for many IoT use-cases.
For the American utility company that implemented this solution, the impact was tremendous. With a uniform aggregation approach across thousands of wind turbines, data consumers from maintenance, performance, and other engineering departments are able to analyze complex trends and take proactive actions to maintain equipment reliability. This integrated data will also serve as the foundation for future machine learning use-cases around fault prediction and can be joined with high-volume vibration data for additional near real-time analysis.
Stateful streaming aggregations such as integrals are just one tool in the modern data engineer's toolbelt, and with Databricks it is simple to apply them to business-critical applications involving streaming data.

