


Modular Orchestration with Databricks Workflows
Thousands of Databricks customers use Databricks Workflows every day to orchestrate business critical workloads on the Databricks Lakehouse Platform. As is often the...
For data-driven enterprises, data analysts play a crucial role in extracting insights from data and presenting it in a meaningful way. However, many analysts might not have the familiarity with data orchestration required to automate their workloads for production. While a handful of ad-hoc queries can quickly turn around the right data for a last-minute report, data teams must ensure that various processing, transformation, and validation tasks are executed reliably and in the right sequence. Without the proper orchestration in place, data teams lose the ability to monitor pipelines, troubleshoot failures, and manage dependencies. As a result, sets of ad-hoc queries that initially brought quick-hitting value to the business end up becoming long-term headaches for the analysts who built them.
Pipeline automation and orchestration becomes particularly crucial as the scale of data grows and the complexity of pipelines increases. Traditionally, these responsibilities have fallen on data engineers, but as data analysts begin to develop more assets in the lakehouse, orchestration and automation becomes a key piece to the puzzle.
For data analysts, the process of querying and visualizing data should be seamless, and that's where the power of modern tools like Databricks Workflows comes into play. In this blog post, we'll explore how data analysts can leverage Databricks Workflows to automate their data processes, enabling them to focus on what they do best - deriving value from data.
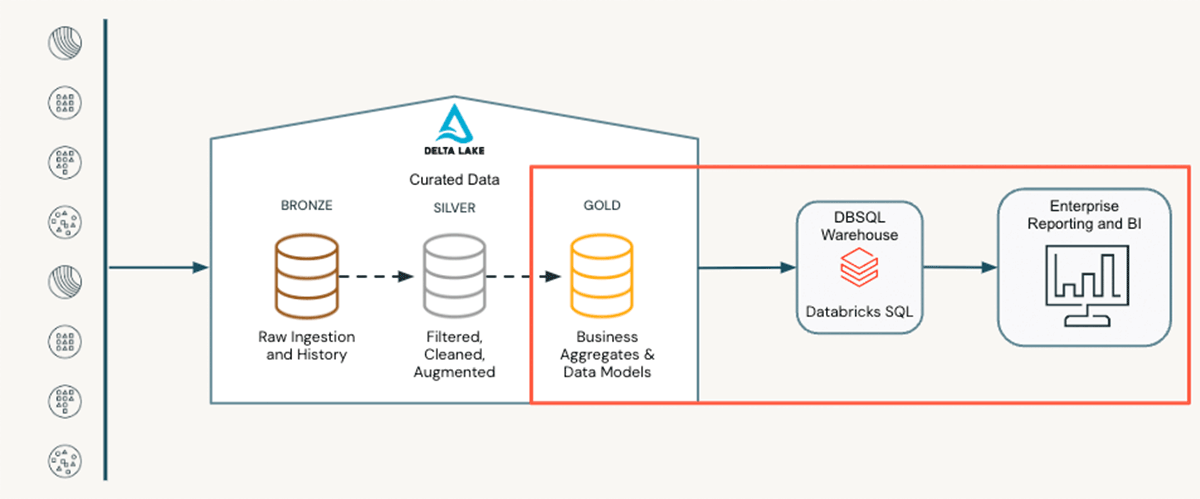
Data analysts play a vital role in the final stages of the data life cycle. Positioned at the "last mile", they rely on refined data from upstream pipelines. This could be a table prepared by a data engineer or the output predictions of machine learning models built by data scientists. This refined data, often referred to as the silver layer in a medallion architecture, serves as the foundation for their work. Data analysts are responsible for aggregating, enriching, and shaping this data to answer specific questions for their business, such as:
These aggregations and enrichments build out the gold layer of the medallion architecture. This gold layer enables easy consumption and reporting for downstream users, typically in a visualization layer. This can take the form of dashboards within Databricks or be seamlessly generated using external tools like Tableau or Power BI via Partner Connect. Regardless of the tech stack, data analysts transform raw data into valuable insights, enabling informed decision-making through structured analysis and visualization techniques.
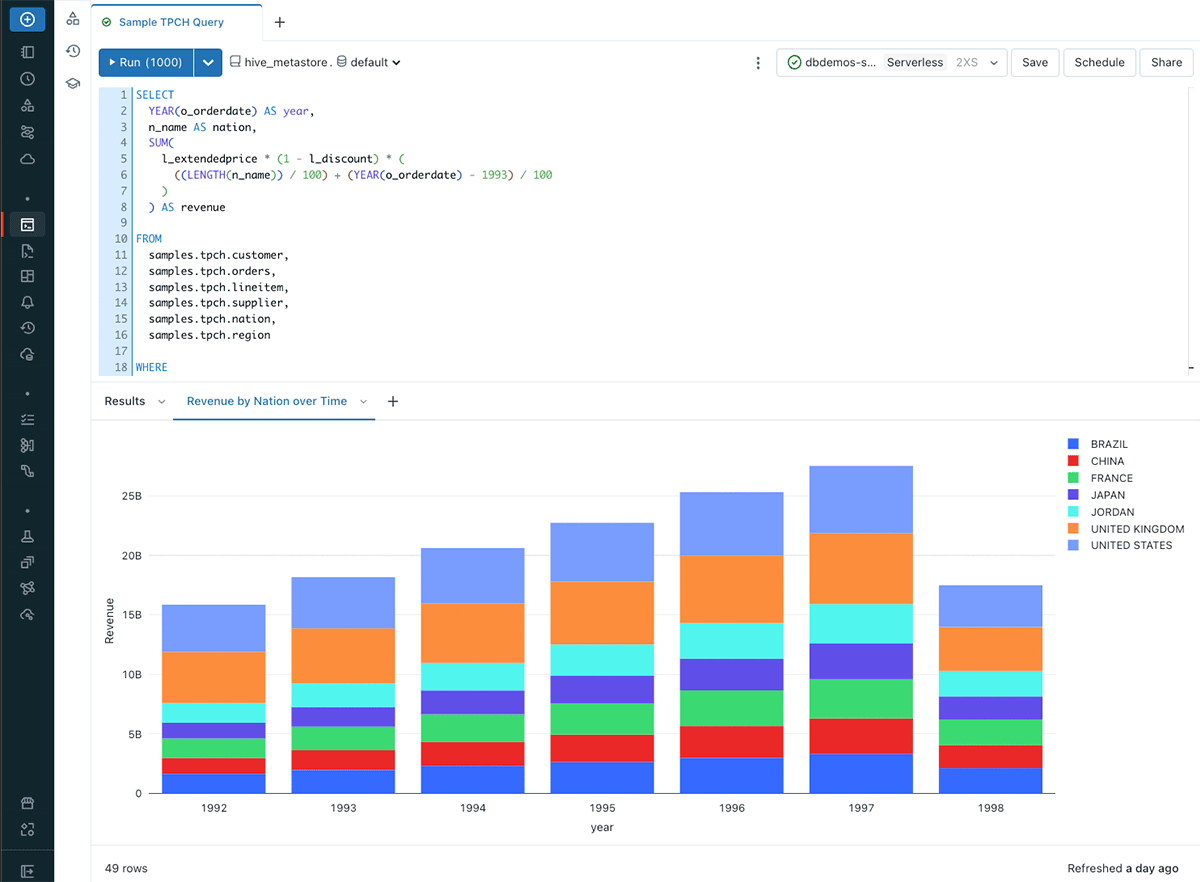
In Databricks, data analysts have a robust toolkit at their fingertips to transform data effectively on the lakehouse. Centered around the Databricks SQL Editor, analysts have a familiar environment for composing ANSI SQL queries, accessing data, and exploring table schemas. These queries serve as building blocks for various SQL assets, including visualizations that offer in-line data insights. Dashboards consolidate multiple visualizations, creating a user-friendly interface for comprehensive reporting and data exploration for end users. Additionally, Alerts keep analysts informed about critical dataset changes in real-time. Serverless SQL Warehouses are underpinning all these features, which can scale to handle diverse data volumes and query demands. By default, this compute uses Photon, the high-performance Databricks-native vectorized query engine, and is optimized for high-concurrency SQL workloads. Finally, Unity Catalog allows users to easily govern structured and unstructured data, machine learning models, notebooks, dashboards and files in the lakehouse. This cohesive toolkit empowers data analysts to transform raw data into enriched insights seamlessly within the Databricks environment.
For those new to Databricks, Workflows orchestrates data processing, machine learning, and analytics pipelines in the Databricks Lakehouse Platform. Workflows is a fully managed orchestration service integrated with the Databricks platform, with high reliability and advanced observability capabilities. This allows all users, regardless of persona or background, to easily orchestrate their workloads in production environments.
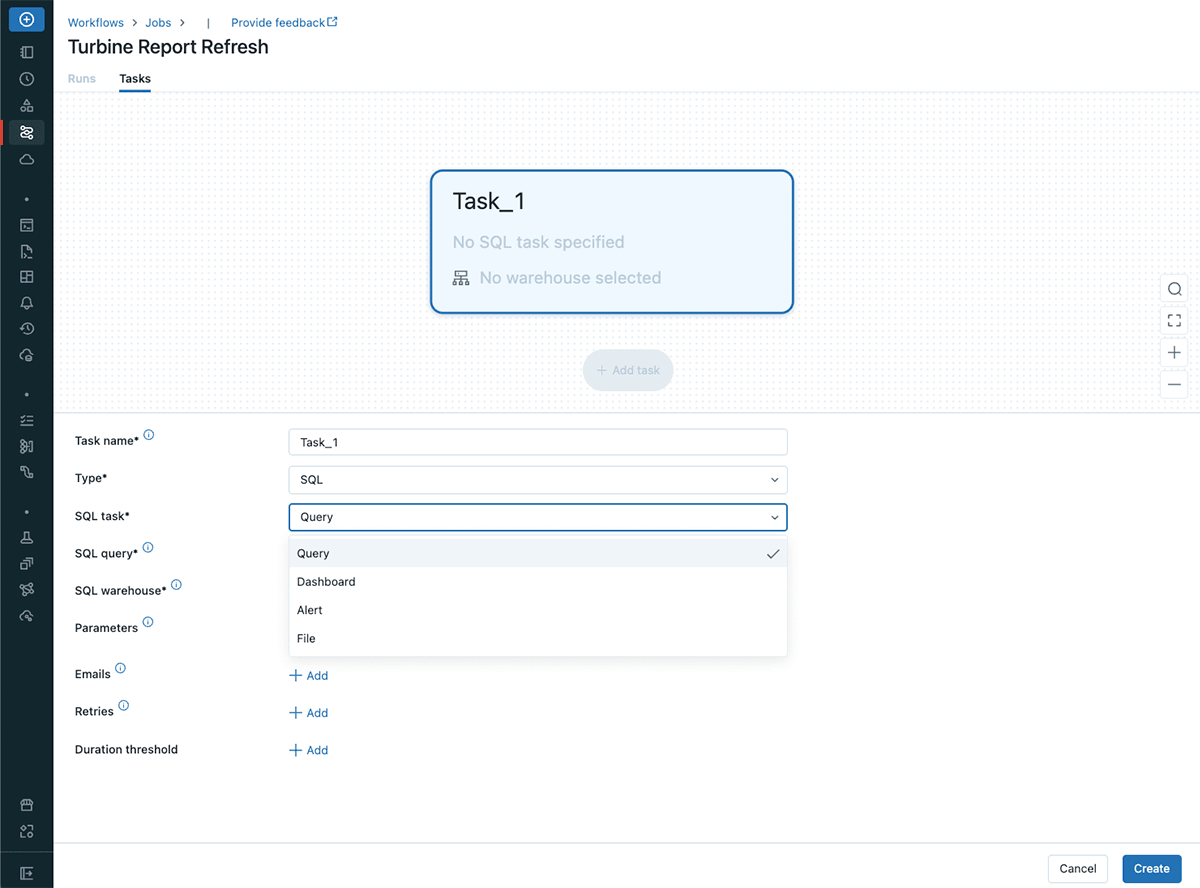
Authoring Your SQL Tasks
Building your first Workflow as a data analyst is extremely simple. Workflows now seamlessly integrates the core tools used by data analysts—Queries, Alerts, and Dashboards—within its framework, enhancing its capabilities through the SQL task type. This allows data analysts to build and work with the tools they are already familiar with and then easily bring them into a Workflow as a Task via the UI.
As data analysts begin to chain more SQL tasks together, they will begin to easily define dependencies between and gain the ability to schedule and automate SQL-based tasks within Databricks Workflows. In the below example workflow, we see this in action:
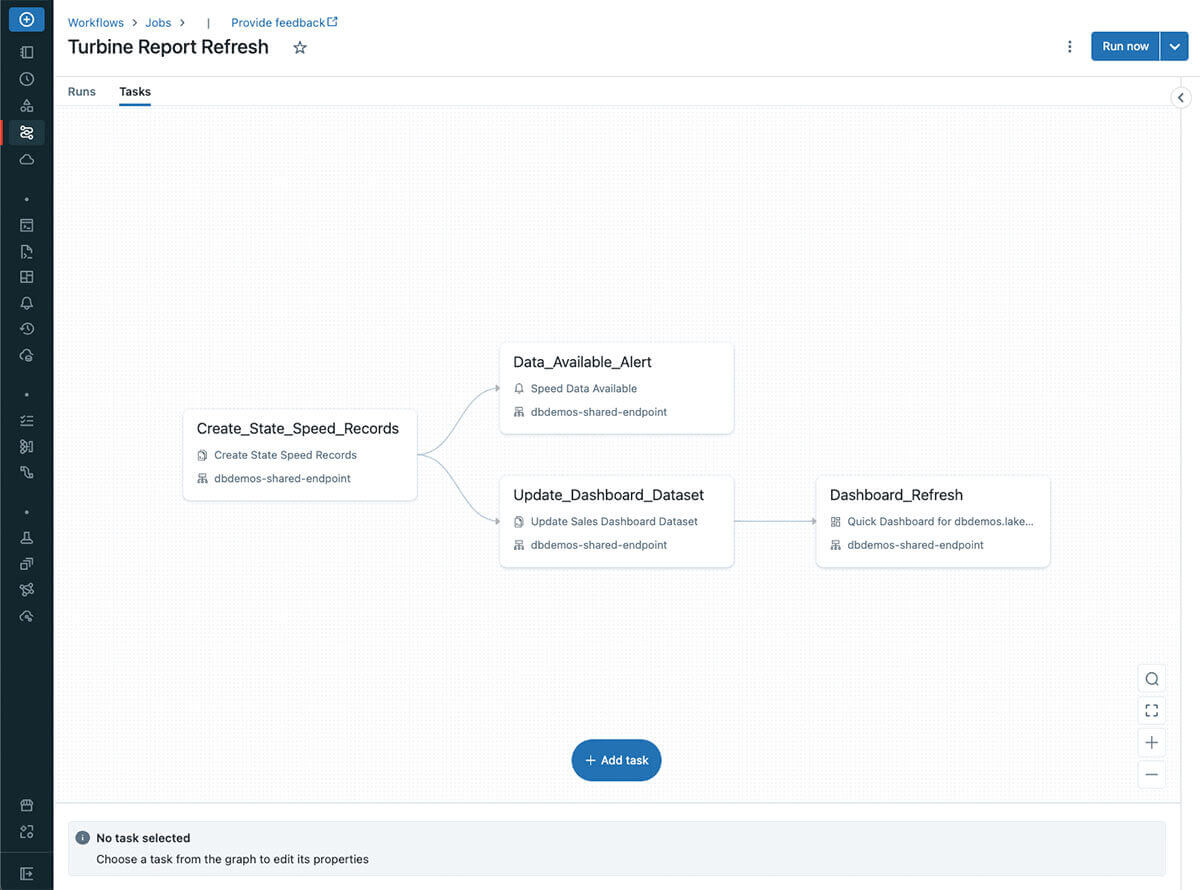
Imagine that we have received upstream data from our data engineering team that allows us to begin our dashboard refresh process. We can define SQL-centric tasks like the ones below to automate our pipeline:
It is worth noting that this example Workflow utilizes queries directly written in the Databricks SQL Editor. A similar pattern can be achieved with SQL code coming from a repository using the File task type. With this task type, users can execute .sql files stored in a Git repository as part of an automated Workflow. Each time the pipeline is executed, the latest version from a specific branch will be retrieved and executed. To learn more about the File task type, check out this announcement blog.
Although this example is basic, you can begin to see the possibilities of how a data analyst can define dependencies across SQL task types to build a comprehensive analytics pipeline.
Monitoring Your Production Pipelines
While authoring is comprehensive within Workflows, it is only one part of the picture. Equally important is the ability to easily monitor and debug your pipelines once they are built and in production.
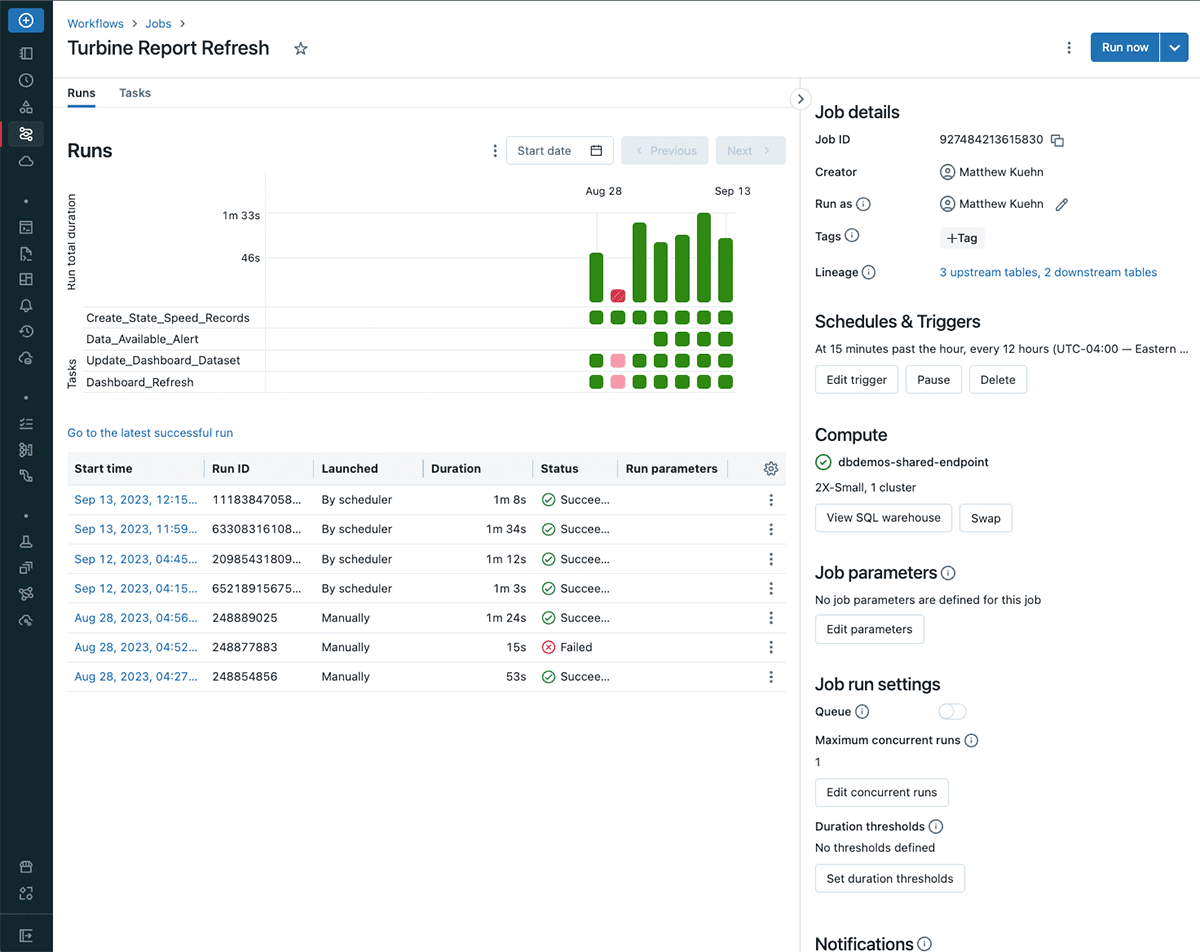
Workflows allows users to monitor individual job runs, offering insights into task outcomes and overall execution times. This visibility helps analysts understand query performance, identify bottlenecks, and address issues efficiently. By promptly recognizing tasks that require attention, analysts can ensure seamless data processing and quicker issue resolution.
When it comes to executing a pipeline at the right time, Workflows allows users to schedule jobs for execution at specific intervals or trigger them when certain files arrive. In the above image, we were first manually triggering this pipeline to test and debug our tasks. Once we got this to a steady state, we began triggering this every 12 hours to accommodate for data refresh needs across time zones. This flexibility accommodates varying data scenarios, ensuring timely pipeline execution. Whether it's routine processing or responding to new data batches, analysts can tailor job execution to match operational requirements.
Late arriving data can bring a flurry of questions to a data analyst from end users. Workflows enables analysts and consumers alike to stay informed on data freshness by setting up notifications for job outcomes such as successful execution, failure, or even a long-running job. These notifications ensure timely awareness of changes in data processing. By proactively evaluating a pipeline’s status, analysts can take proactive measures based on real-time information.
As with all pipelines, failures will inevitably happen. Workflows helps manage this by allowing analysts to configure job tasks for automatic retries. By automating retries, analysts can focus on generating insights rather than troubleshooting intermittent technical issues.
In the evolving landscape of data analysis tools, Databricks Workflows bridges the gap between data analysts and the complexities of data orchestration. By automating tasks, ensuring data quality, and providing a user-friendly interface, Workflows empower analysts to focus on what they excel at - extracting meaningful insights from data. As the concept of the lakehouse continues to unfold, Workflows stand as a pivotal component, promising a unified and efficient data ecosystem for all personas.

