

How Data Observability Helps Ensure Data Quality for Retail

The retail industry relies heavily on data to drive business decisions, optimize operations, and enhance customer experiences. With the advent of big data and advanced analytics, retailers can leverage vast amounts of information to gain valuable insights. When that data is accurate and of optimal quality, it can give a retailer significant business advantages that will play out in its strategy and overall competitiveness. Data of poor quality, however, will derail even the most minor operational efforts. Data observability provides retailers with data reliability and insights into operations and spend that ensure they are receiving the most value from their data. In this blog, we will explore the concept of data observability in the retail domain, its use cases, and the benefits it brings to retailers and solution providers.
Understanding Data Observability
Data observability refers to the practice of monitoring and ensuring the reliability, quality, and accuracy of data, pipelines and infrastructure. It involves continuously tracking data pipelines, identifying anomalies, and proactively addressing issues to maintain data integrity. In the retail industry, data observability plays a crucial role in various use cases, such as forecasting and replenishment, inventory optimization, predictive pricing, smart merchandising, assortment planning, recommendation engines, and behavioral analytics.
Retail Data Use Cases
Let's delve into some of the common retail use cases where data observability is essential:
1. Forecasting and Replenishment
Forecasting and replenishment are core functions for any retailer. By leveraging sophisticated software systems, retailers can effectively manage their supply chain, optimize inventory levels, and ensure timely replenishment of products. Data observability helps in identifying over-stocking or under-stocking situations, reducing costs associated with storage and transportation, and increasing sales by accurately predicting demand.
2. Inventory Optimization
Inventory optimization is crucial to maximize the value of investments in inventory. Without data observability, retailers may experience suboptimal usage of inventory, leading to financial losses. By ensuring data quality and accuracy, retailers have an accurate picture of what they have on-hand and can determine what they need to order and/or create. With that information, they can strategically plan their inventory, align it with changing customer demands, and reinvest cost savings into achieving strategic goals.
3. Predictive Pricing
Accurate pricing models are essential for retailers to stay competitive and meet customer expectations. Poor-quality source data can result in inaccurate pricing models, leading to financial losses and dissatisfied customers. Data observability helps ensure the accuracy and optimal pricing of products by identifying and addressing data issues that may impact pricing models.
4. Smart Merchandising
Effective merchandising requires leveraging data from multiple channels to optimize product catalogs and align them with changing customer demands. Without proper data observability, retailers may not fully leverage the available data, leading to missed opportunities for improving merchandising strategies. Meanwhile, those retailers that do have the insights that data observability provides will be able to move and pivot rapidly. By monitoring data pipelines and ensuring data quality, retailers can organize their product catalogs effectively and align them with customer preferences.
5. Assortment Planning
Assortment planning involves strategically planning inventory and managing catalogs based on changing demand patterns. Without data observability, retailers may struggle to respond to changing demand effectively, resulting in missed sales opportunities or excess inventory. By continuously monitoring and ensuring data quality, retailers can make informed decisions, align their inventory with market trends, and optimize assortment planning.
6. Recommendation Engines
Recommendation engines play a crucial role in delivering personalized and relevant product recommendations to customers. However, as new trends emerge, the accuracy of recommendation models can decline. Data observability enables retailers to detect new trends, retrain recommendation models with accurate data, and maintain the effectiveness of their recommendation engines.
7. Behavioral Analytics
Behavioral analytics help retailers gain insights into customer behavior and preferences, enabling targeted marketing and personalized experiences. Outdated models resulting from poor data quality can lead to inefficient targeting and suboptimal customer experiences that confuse buyers and present the retailer as out of touch. Data observability ensures that behavioral analytics models are aligned with the most accurate and up-to-date data, enhancing the effectiveness of targeted marketing efforts.
Common Data Challenges
In an effort to orchestrate and manage their data environments, data teams in retail organizations face several common challenges that data observability can fix. These include:
1. Complex Data Pipelines
Retailers deal with complex data pipelines involving multiple systems, both within the organization and those from external sources. Reconciling data across these systems and identifying changes in data can be challenging for data engineering teams, leading to delays and potential data inconsistencies.
2. Timeliness Issues
Data in the retail industry is often extracted from various sources, and ensuring timely availability of this data is critical for retailers to act on it in a way that gives them economic advantages. Delays in data extraction can impact decision-making and lead to inefficiencies in operations.
3. Mismatches and Incorrect Data
Mismatches between master data (e.g., location, item, vendor) and transactional data (e.g., warehouse transfers, shipments, inventory) is common in large, complex data environments, resulting in inaccuracies and discrepancies. Incorrect status codes and duplicate records can further compound data quality issues which leads to inaccurate inventory status and the inability to predict critical logistical elements.

Typical Data Feeds in Retail
Retail organizations rely on various data feeds to support forecasting and replenishment processes. Some of the typical data feeds include:
- Location: Information about stores and warehouses, including addresses, geolocation, and attributes specific to each location.
- Vendor/Supplier: Details about vendors and suppliers, such as contact information, contracts, and performance metrics.
- Calendar: Retail-specific calendars defining important dates, holidays, and seasonal variations.
- Item/Product/Part: Comprehensive data about items, products, or parts, including attributes, classifications, and relationships.
- Forecasts: Initial and historical sales forecasts used for planning and decision-making.
- Store Orders: Orders placed by stores for replenishing stock.
- Transit-related Feeds: Data related to the transportation of goods, such as tracking information and delivery schedules.
- Promotional Details: Information about promotions, discounts, and marketing campaigns.
- Inventory: Daily item-level inventory records, including stock levels and location-specific details.
- Purchase Orders: Records of purchase orders placed with vendors.
- Sales: Transactional data capturing sales transactions, including item details, quantities, and prices.
- Receipts: Records of goods received from vendors.
- Shipments: Information about shipments from vendors to stores or warehouses.
- Safety Stock Data: Data related to safety stock levels, ensuring buffer stock availability.
- Assortment Plans: Plans for product assortments, reflecting changes in demand and seasonality.
By ensuring data observability across these data feeds, retailers can improve the accuracy, efficiency, and effectiveness of their forecasting and replenishment processes.
Example: Typical Architecture for Forecasting and Replenishment Systems
Forecasting and replenishment systems in retail typically have the following architecture:
- ETL System within the Retailer: Data is extracted from various systems using an ETL (Extract, Transform, Load) process. This system is often built on technologies like Hadoop or Databricks, either on-premises or in the cloud.
- Data Transfer to Solution Vendor: The retailer pushes the extracted data to the cloud buckets of the forecasting and replenishment solution vendor. This transfer is typically done via batch processes or APIs.
- Inbound and Outbound ETL Layers: The solution vendor has inbound and outbound ETL layers to transform the customer data into a format compatible with their forecasting and replenishment solver. Some parts of the solver logic may be executed in platforms like Hive, Databricks, or Dataproc.
- Integration with Downstream Systems: The retailer integrates the outbound feeds from the solution vendor with their downstream systems. This integration can be done through batch processing or APIs, often utilizing technologies like Spark or Hive.
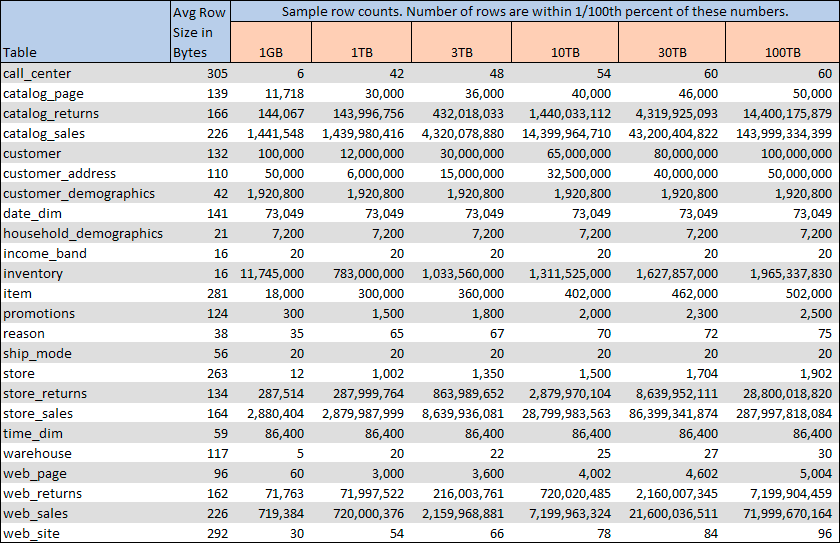
Sample TPC-DS data set

Example Data Reliability Scenarios
- Completeness of master data like calendar and specific item
- Timing issues/failures in daily batches can lead to incomplete data in downstream systems
- Duplicate values in Key columns
- This issue leads to multiplication of calculated values. For example duplicates in Item table can lead to exaggerated onhand inventory
- Tables are not reconciling
- Need to investigate if two tables are reconciling with each other to ensure accuracy
- Incomplete list of records [Enumeration]
- Not all codes were extracted from source systems when loading data. This leads to partial data loaded.
- Alerts: Raise alerts when Average number of queries runs above a set of values; Alert on Usage of snowflake credits; Alert on large data pulls
Example use case
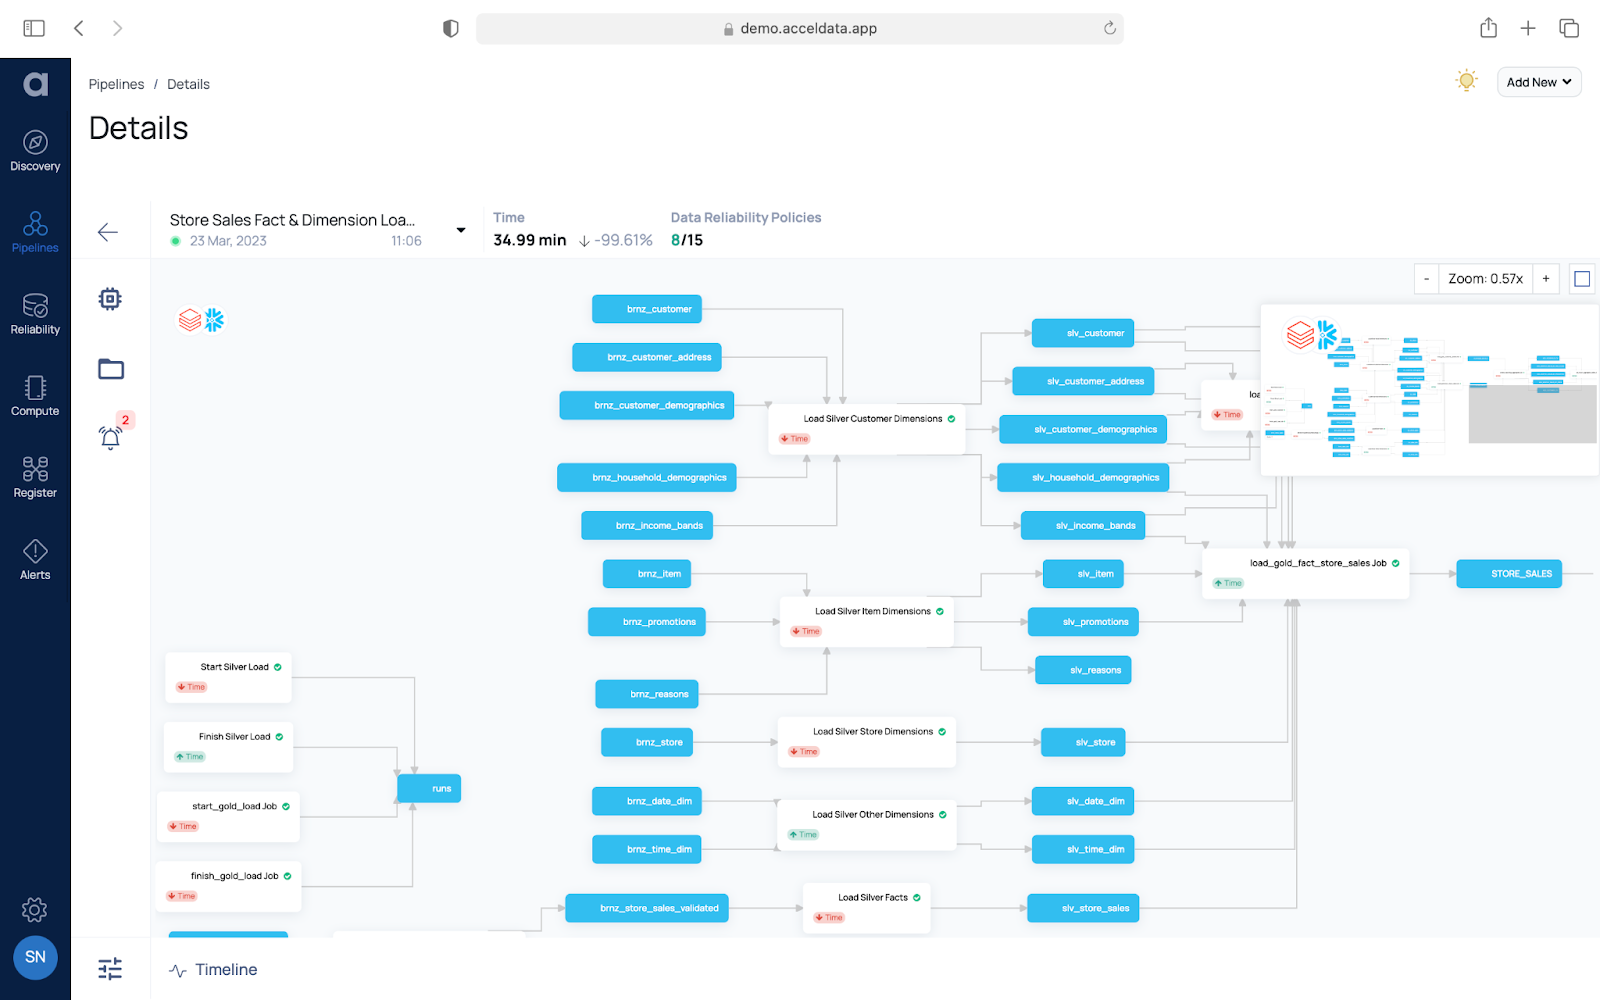
Retail applications typically pull data from many different sources and integrate these data into feeds. These feeds are then loaded to solvers , For example - Replenishment and forecasting solvers. The solvers may be hosted within the Retail organization or may be outsourced to third party specialists.
First, The completeness of master data is critical to data quality. For example, if Item master tables are missing some items, then these items will be missing in further calculations like the Total on hand inventory.
In order to demonstrate this capability select, the policy is at:
DataReliability > Policies > RetailDemo_CustomerTime_Reconciliation
This policy checks if customer’s dates are aligned to the time dimension.
Due to operational issues, duplicate data may get introduced into master tables. The consequence of this is that the downstream calculations may double count critical metrics.
An example of this policy is at:
DataReliability > Policies > RetailDemo_Time_NullDuplicateChecks
Multiple data checks by asset - view data violations, like:
DataReliability > Asset List > Search for Customer table in (RETAILDEMO_002)
The retail system typically uses many codes to represent statuses. It may be required to check the values of codes against a known list of codes (master records):
DataReliability > Asset List > RetailDemo_CustomerDemographics_Gender
In this policy two conditions are set, one to check for values of M,F and another negative test case to check for values of o. The first passes 100%, the second check fails with 0% cases.
This type of check can be implemented to check for anomalies and edge cases. Weight can be assigned to set the impact of the error condition:
RetailDemo_001_ItemChecks
Create a Null and Duplicate check policy named . The following four Rules were set up on the Item table
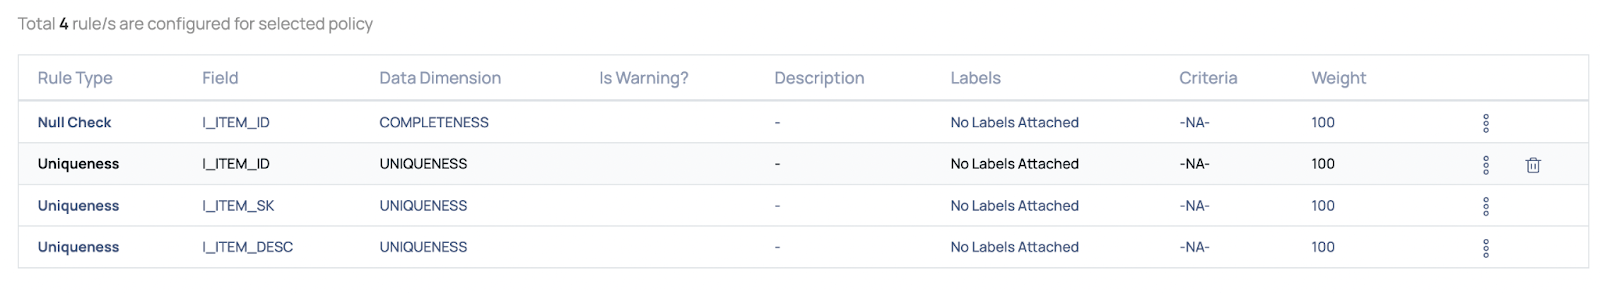
The result of the data quality job is as follows:

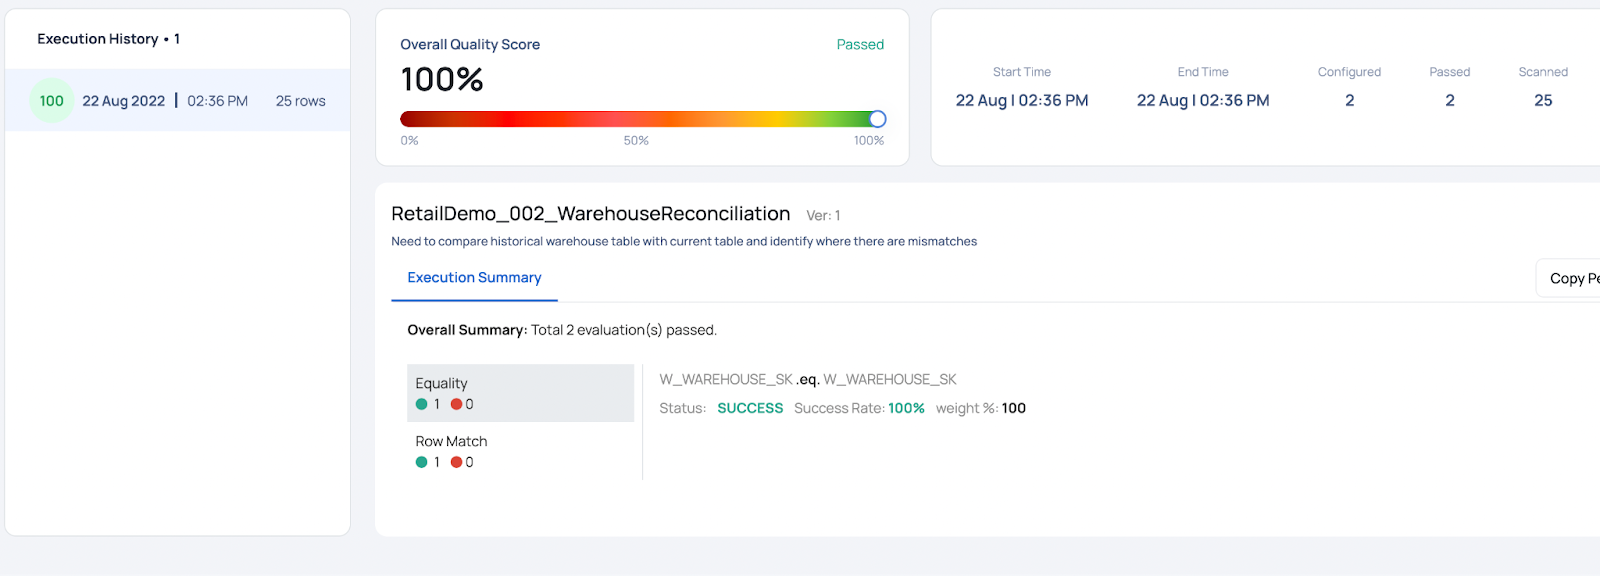
RetailDemo_002_WarehouseReconciliation
Reconciling two tables - Backup of Warehouse and New Warehouse table

Success: The original table is accurate with respect to the process when re-executed
RetailDemo_003_Enumeration_CustomerDemographics
Checking for violations of an enumeration

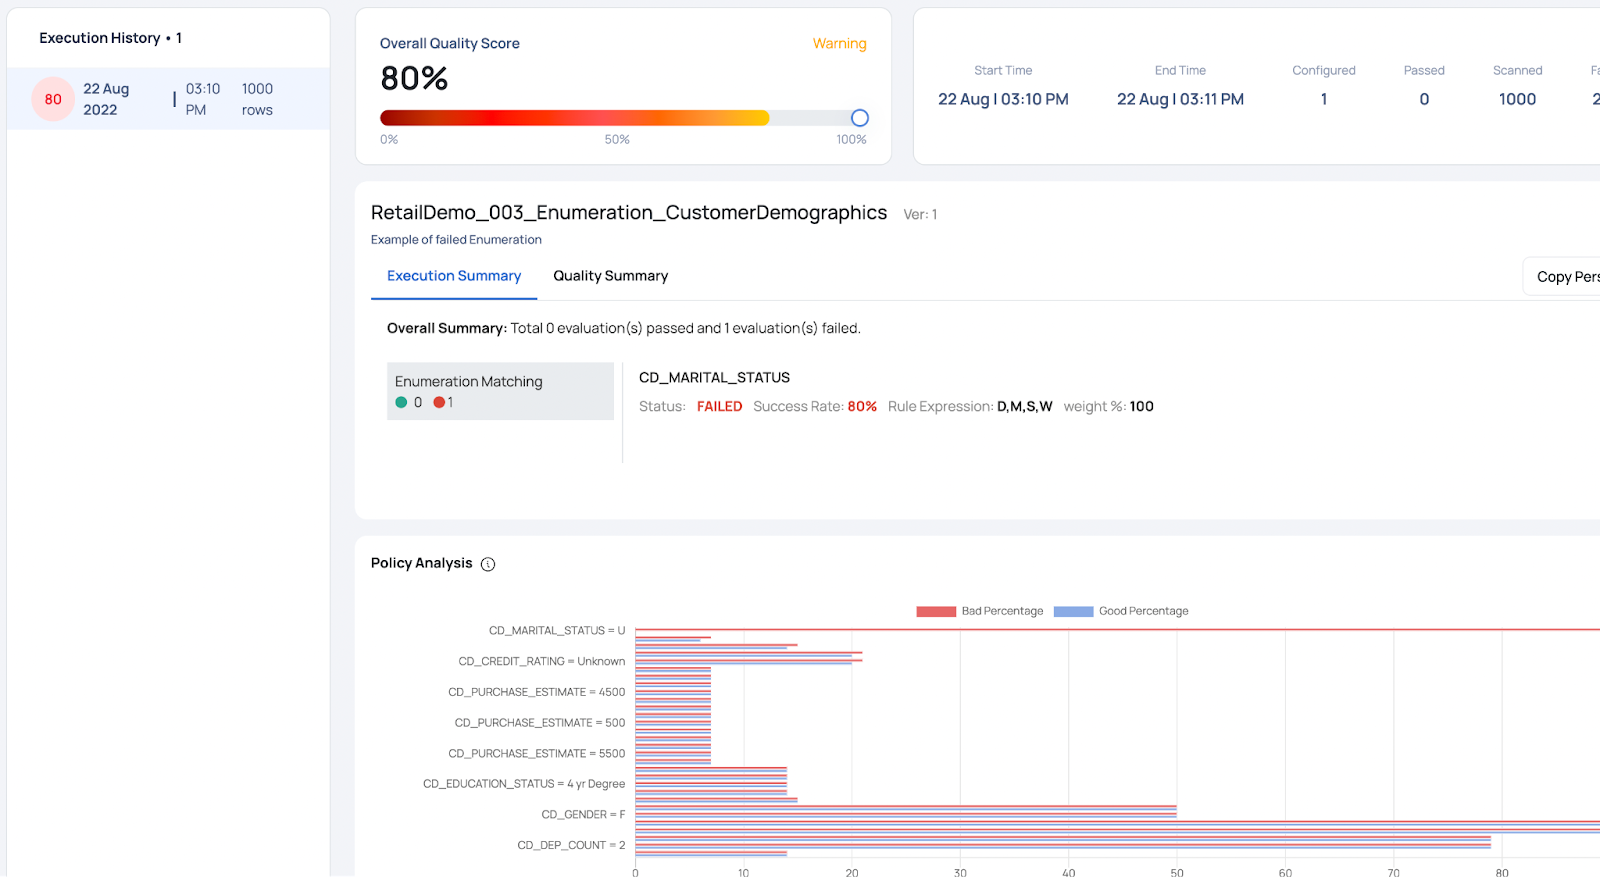
All data violations are of unknown statuses

Data Reliability in the Acceldata Data Observability Platform
Data observability clearly plays a crucial role in the retail industry. By addressing common challenges, implementing robust data pipelines, and measuring the impact of data issues, retailers can enhance decision-making, optimize inventory management, and deliver better customer experiences.
The Acceldata Data Observability Platform empowers data teams with comprehensive visibility into your essential data assets and pipelines, enabling you to achieve the utmost levels of data reliability. Throughout the entire journey of your data, from its source to its final destination, all data assets and pipelines are continuously monitored. At each intermediate stop along the way, thorough checks are performed to ensure data quality and reliability.
Acceldata facilitates the alignment of your data strategy and data pipelines with your business requirements, enabling data teams to assess the impact of data issues on business objectives. By identifying and isolating errors that affect business functions, teams can prioritize their efforts and efficiently resolve inefficiencies based on their urgency and impact on the business.
Acceldata’s Data Observability Platform embraces an end-to-end, shift-left approach to data reliability. It achieves this by actively monitoring data assets across the entire pipeline, detecting and addressing problems early on, before low-quality data reaches the consumption zone. This comprehensive approach extends to data-at-rest, data-in-motion, and data-for-consumption, covering your entire data pipeline.
To learn more about data reliability within the Data Observability Platform, please visit our data reliability solutions page and review some of your data reliability assets.
Photo by Alexander Kovacs on Unsplash

Similar posts
.webp)


Ready to start your
data observability journey?

.webp)
.webp)