As Eventbrite engineering leans into team-owned infrastructure, or DevOps, we’re obviously learning a lot of new technologies in order to stand up our infrastructure, but owning the infrastructure also means it’s up to us to make sure that infrastructure is stable as we continue to release software. Obviously, the answer is that we need to own monitoring our services, but thinking about what and how to monitor your system requires a different type of mental muscle than day-today software engineering, so I thought it might be helpful to walk through a recent example of how we began monitoring a new service.
The Use-Case
My team recently launched our first production use-case for our new service hosted within our own infrastructure. This use-case was fairly small but vital, serving data to our permissioning service to help it build its permissions graph in its calculate_permissions endpoint. Although we were serving data to only a single client, this client is easily the most trafficked service in our portfolio (outside of the monolith we’re currently decomposing) and calculate_permissions processes around 2000 requests per second. Additionally, performance is paramount as said endpoint is used by a wide variety of services multiple times within a single user request, so t, so much so that the service has traditionally had direct database access, entirely circumventing the existing service we were re-architecting. We needed to ensure that our new service architecture could handle the load and performance demands of a direct database call. If this sounds like a daunting first use-case, you’re not wrong. We chose this use-case because it would be a great test for the primary advantage of the new service architecture: scalability.
The Dashboards
For our own service, we created a general dashboard for service-level metrics like latency, error rate and the performance of our infrastructure dependencies like our Application Load Balancer, ECS and DynamoDB. Additionally, we knew that in order for the ramp-up to be successful, we’d need to closely monitor not only our service’s performance, but even more importantly, we’d need to monitor our impact to the permissions service to which we were serving data. For that, we created another dashboard focused on the use case combining metrics from both our service and our client.
We tracked the performance of the relevant endpoints in both services to ensure we were meeting the target SLOs: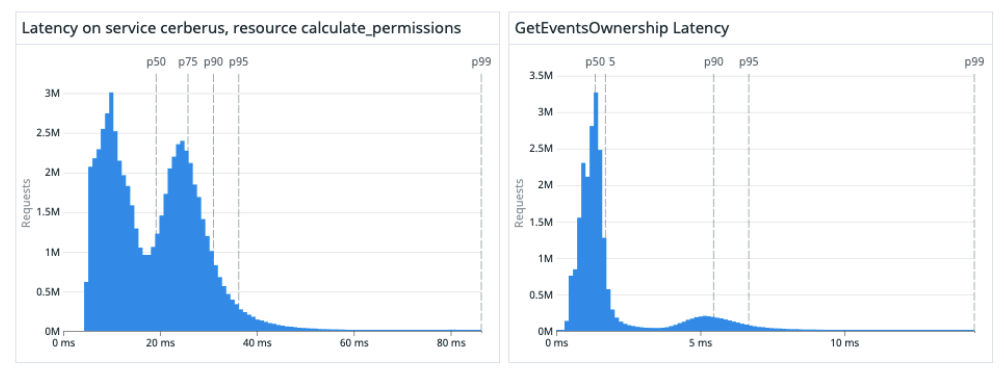
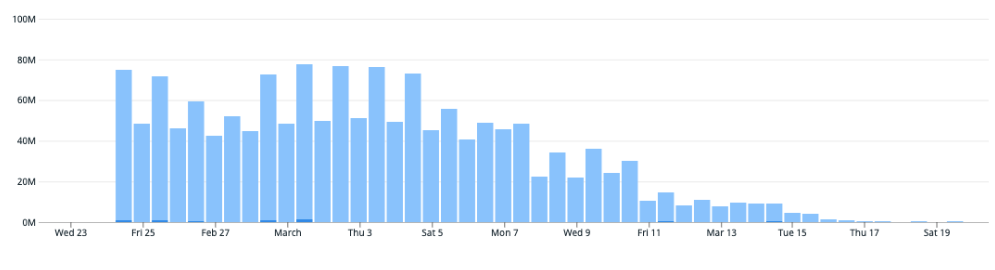
We added charts for our success metrics, in this case, we wanted to decrease the number of direct-database calls from the permissions service which we watched fall as we ramped up the new service.
We added metrics inside of our client code to measure how long the permission service was waiting on calls to our service. In the example below, you can see that the client-implementation was causing very erratic latency (which was not visible on the server side). Seeing this discrepancy in performance on the client and server sides, we detected an issue in our client implementation which had a dramatic impact on performance stability. We addressed this volatility by implementing connection pooling in the client.

As the ramp-up progressed, we also added new charts to the dashboard as we tested various theories. For instance, our cache hit rate was underwhelming. We hypothesized that the format of the ramp up (percentage of requests) actually meant that low percentages would artificially lower our cache hit rate so we added this chart to compare the hit rate against similar time periods. It’s important to keep context in mind; fluctuations may be expected throughout the course of a day or week (I actually disabled the day-over-day comparison below because the previous day was a weekend and traffic was impacted as a result). This new chart made it very easy to confirm our suspicions.

This is just a sampling of the data we’re tracking and the metrics collection we implemented, but the important lesson is that your dashboard is a living project of its own and will evolve as you make new discoveries about your specific system. Are you processing batch jobs? Add metrics to compare how various batch sizes impact performance and how often you get requests with those batch sizes. Are you rolling out a big feature? Consider metrics that allow you to compare system behavior with and without your feature flag on. Think about what it means for your system or project to be successful and think about what additional metrics will help you quantify that impact.
Alerting
Monitoring is particularly great when launching a new system or feature and it can be very helpful when debugging problematic behavior, but for day-to-day operations you’re not likely to pour over your monitors very closely. Instead, it’s essential to be alerted when certain thresholds are approached or specific events happen. Use what you’ve learned during monitors to create meaningful alerts (or alarms).
Let’s revisit the monitor above that leveled out after a client configuration change.
I would probably like to know if something else causes the latency to increase that dramatically. We can see that the P95 latency leveled off around 17ms or so. Perhaps I’d start with an alert triggered when the P95 latency rises above 25ms. Depending on various parameters (time of day, normal usage spikes, etc.), maybe it’s possible for the P95 to spike that high without the need to sound the alarms, so I’d set up the alert to only fire when that performance is sustained over a 5 minute period. Maybe I set up that alert, and it goes off 5 times in the first week and we choose not to investigate based on other priorities. In that case, I should consider adapting the alerts (maybe increasing the threshold or span of time) to better align with my team’s priorities. Alerts should be actionable and the only thing worse than no alert, is an alert that trains your teams to ignore alerts.
Like with monitoring, there is no cookie-cutter solution for alerting. One team’s emergency may be business as usual for another team. You should think carefully about what is a meaningful alert to your team based on the robustness of the infrastructure, your real-world usage patterns and any SLA’s the team is responsible for upholding. Once you’re comfortable with your alerts, they’ll make great triggers for your on-call policies. Taking ownership over your own infrastructure takes a lot of work and can feel very daunting at first, but with these tools in place, you’re much more likely to enjoy the benefits of DevOps (like faster deployments and triage) and spend less time worrying.