Data Visualization: Presenting Complex Information Effectively
KDnuggets
OCTOBER 6, 2023
Learn how to present complex information effectively with data visualization.
 Presentation Related Topics
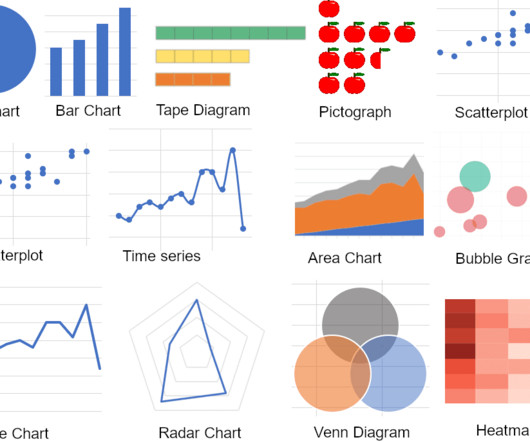
KDnuggets
OCTOBER 6, 2023
Learn how to present complex information effectively with data visualization.
Knowledge Hut
MARCH 29, 2024
One of the most important tools in a project manager's toolkit is the calculation of net present value (NPV). It determines whether a project is expected to generate a positive return and is a fundamental concept of finance that finds wide application within net present value in project management.
This site is protected by reCAPTCHA and the Google Privacy Policy and Terms of Service apply.
KDnuggets
APRIL 1, 2024
This article discusses the psychology of data visualization, including the principles and techniques that underpin the creation of persuasive and effective visuals.

Hevo
APRIL 19, 2024
The ELT process has modernized data pipelines, fastened your data loading speed, and facilitated efficient data analysis. However, there is still a delay in the analysis and the time to obtain reports and insights, as your analysts have to run a few additional data transformation jobs at the warehouse to clean and format the data. […]
Advertisement
Embedding analytics in software presents some unique opportunities—and poses unique challenges—to software teams. What are best practices when designing the UI and UX of embedded dashboards, reports, and analytics? What should software teams know about implementing security that works with the rest of their products?

KDnuggets
JANUARY 7, 2022
How to present yourself as a strong candidate in interview presentations.
databricks
NOVEMBER 30, 2023
We are excited to introduce five new integrations in Databricks Partner Connect—a one-stop portal enabling you to use partner solutions with your Databricks D.
Advertisement
Why do some embedded analytics projects succeed while others fail? We surveyed 500+ application teams embedding analytics to find out which analytics features actually move the needle. Read the 6th annual State of Embedded Analytics Report to discover new best practices. Brought to you by Logi Analytics.
Advertisement
Embedding dashboards, reports and analytics in your application presents unique opportunities and poses unique challenges. We interviewed 16 experts across business intelligence, UI/UX, security and more to find out what it takes to build an application with analytics at its core.

Expert insights. Personalized for you.


Let's personalize your content