 Patrick Rogers
As DoorDash experienced rapid growth over the last few years, we began to see the limits of our traditional methods of monitoring. Metrics, logs, and traces provide vital information about our service ecosystem. But these signals almost entirely rely on application-level instrumentation, which can leave gaps or conflicting semantics across different systems. We decided to seek potential solutions that could provide a more complete and unified picture of our networking topology.
One of these solutions has been monitoring with eBPF, which allows developers to write programs that are injected directly into the kernel and can trace kernel operations. These programs, designed to provide lightweight access to most components of the kernel, are sandboxed and validated for safety by the kernel before execution. DoorDash was particularly interested in tracing network traffic via hooks called kprobes (kernel dynamic tracing) and tracepoints. With these hooks, we can intercept and understand TCP and UDP connections across our multiple Kubernetes clusters.
By building at the kernel level, we can monitor network traffic at the infrastructure level, which gives us new insights into DoorDash’s backend ecosystem that’s independent of the service workflow.
To run these eBPF probes, we have developed a Golang application called BPFAgent, which we run as a daemonset in all of our Kubernetes clusters. Here we will take a look at how we built BPFAgent, the process of building and maintaining its probes, and how various DoorDash teams have used the data collected.
Building BPFAgent
We developed the first version of BPFAgent using bcc and iovisor/gobpf libraries. This initial iteration helped us understand how to develop and deploy eBPF probes within our Kubernetes environment.
While we quickly confirmed the value of investing in developing BPFAgent, we also experienced multiple pain points related to this version’s poor development lifecycle and slow start-up times. Using bcc meant that probes were compiled at runtime, significantly increasing our start-up times when deploying new versions. This made gradual rollouts of new versions difficult because of the considerable time required to monitor a new deployment. Additionally, the probes had a hard dependency on the Linux kernel version of the Kubernetes node and all kernel versions had to be accounted for in our Docker images. On multiple occasions, an upgrade to the underlying OS for our Kubernetes nodes caused BPFagent to stop working until it could be updated to support the new Linux version.
We were delighted to find that the community had already started to address these pain points with BPF CO-RE — compile-once run-everywhere. Using CO-RE, we moved from compiling probes with bcc at runtime to compiling our probes with Clang during the build process for the BPFAgent Golang application. This change relied on Clang’s ability to compile a probe in BPF Type Format (BTF), which creates executable versions of probes that are largely independent of the kernel version through using libbpf and memory relocation information. The change prevents most OS and kernel updates from impacting our BPFAgent application or its probes. For a more detailed introduction to BPF portability and CO-RE, see Andrii Nakryiko's blog post on the subject.
The Cilium project has an exceptional cilium/ebpf Golang library that compiles and interacts with eBPF probes within Golang code. It has easy-to-use go:generate integration that runs Clang to compile eBPF C code into the BTF format, subsequently wrapping BTF artifacts in an easy-to-use Go package to load the probes.
After switching to CO-RE and cilium/ebpf, we observed a 40% reduction in memory usage, a 98% reduction in container restarts due to OOMKilled, and an 80% decrease in our deployment time per Kubernetes cluster. Overall, a single BPFAgent instance reserves less than 0.3% of a typical node’s CPU cores and memory.
BPFAgent Internals
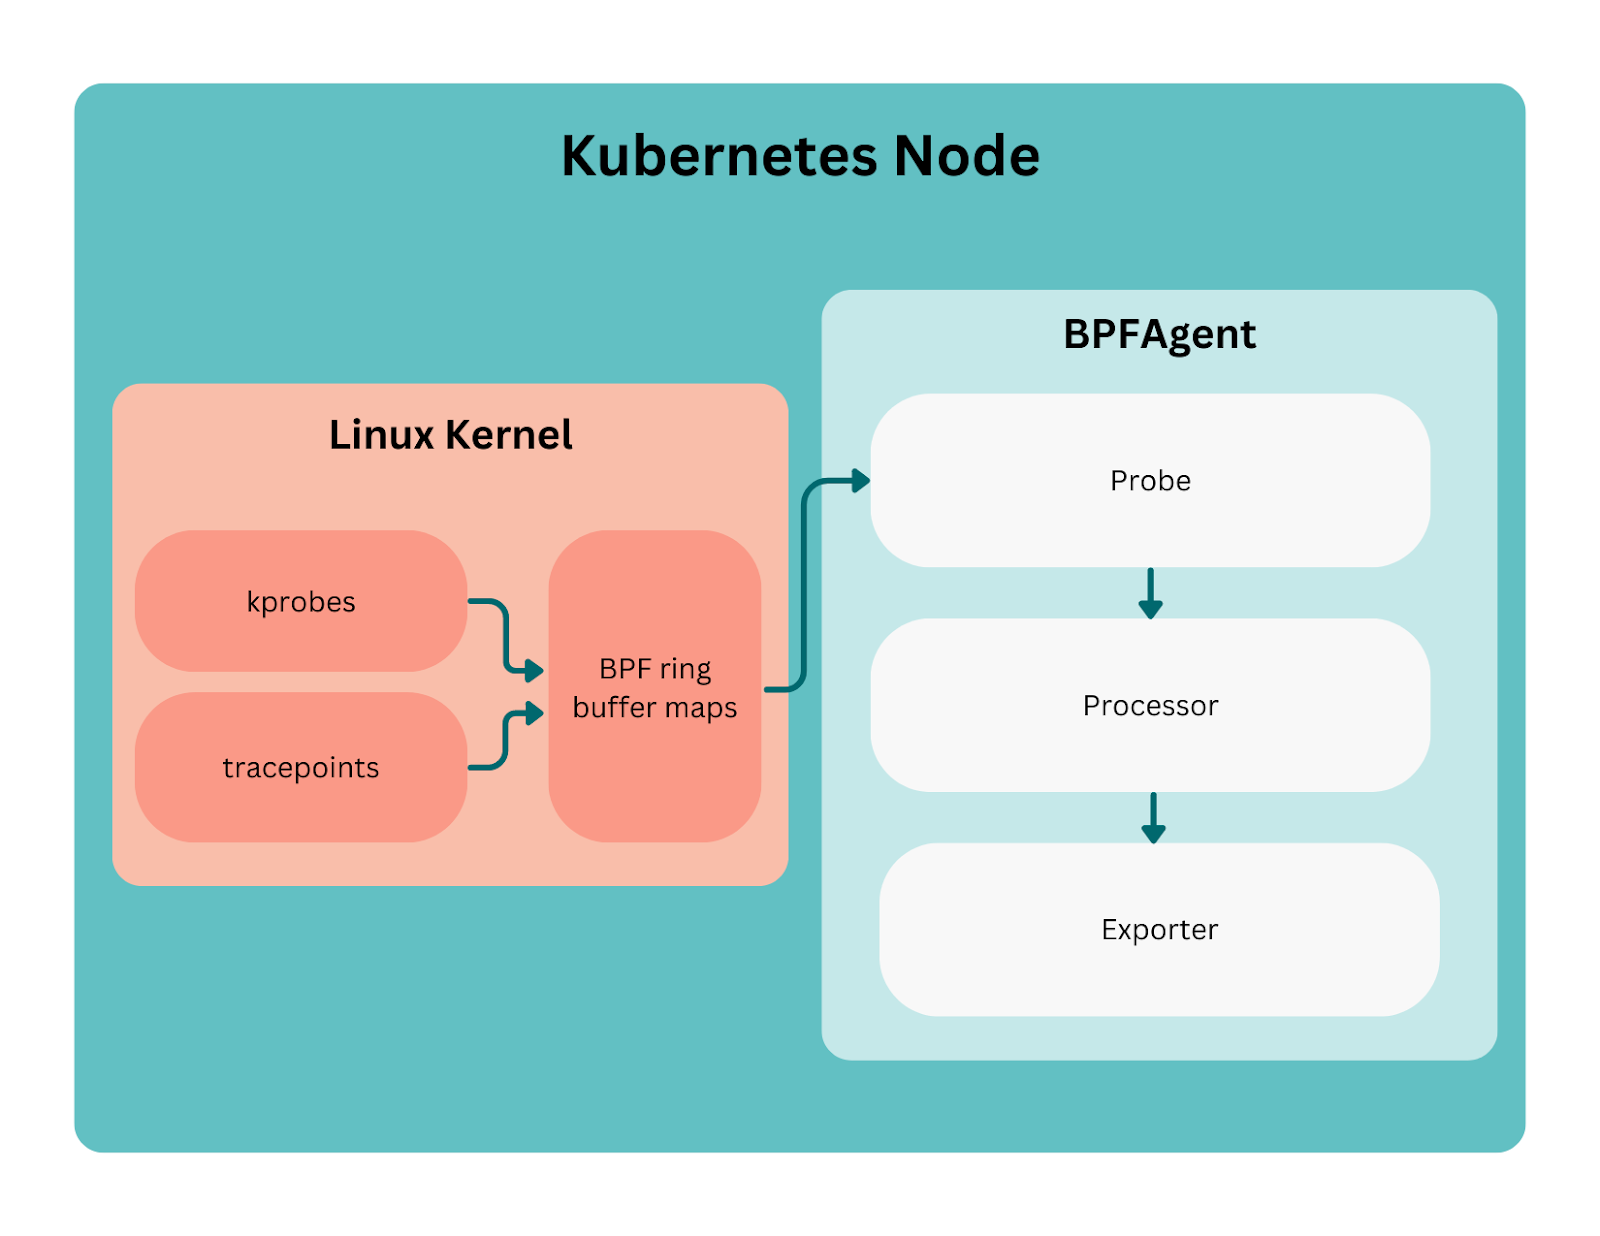
The BPFAgent application is composed of three main components. As shown in Figure 1 below, BPFAgent first instruments the kernel via our eBPF probes to capture and produce events. These events then go to processors to be enriched based on process and Kubernetes information. Ultimately, the enriched events are emitted via an exporter to our data store.
Figure 1:
Let’s dive into how we build and maintain our probes. Each probe is a Go module with three main components: the eBPF C code and its generated artifacts, a probe runner, and an event type.
The probe runners follow a standard pattern. During initial probe creation, we load the BPF code via the generated code (the loadBpfObjects function in the code snippet below) and also create a channel for our events to be sent for handling by bpfagent’s processors and exporter functions.
type Probe struct {
	objs  bpfObjects
	link  link.Link
	rdr  *ringbuf.Reader
	events chan Event
}

func New(bufferLimit int) (*Probe, error) {
	var objs bpfObjects

	if err := loadBpfObjects(&objs, nil); err != nil {
		return nil, err
	}

	events := make(chan Event, bufferLimit)

	return &Probe{
		objs:  objs,
		events: events,
	}, nil
}
After this step, it is injected into the kernel as part of the Attach() procedure in BPFagent. The probe is loaded, attached, and linked with the desired Linux syscall, such as skb_consume_udp. Upon success, a new ring buffer reader is created referencing our BPF ring buffer. Finally, a goroutine is started to poll for new events to be unmarshalled and published to the channel.
func (p *Probe) Attach() (<-chan *Event, error) {
	l, err := link.Kprobe("skb_consume_udp", p.objs.KprobeSkbConsumeUdp, nil)

	// ...

	rdr, err := ringbuf.NewReader(p.objs.Events)

	// ...

	p.link = l
	p.rdr = rdr

	go p.run()

	return p.events, nil
}

func (p *Probe) run() {
	for {
		record, err := p.rdr.Read()

		// ...

		var event Event

		if err = event.Unmarshal(record.RawSample, binary.LittleEndian); err != nil {
			// ...
		}

		select {
		case p.events <- event:
			continue
		default:
			// ...
		}
	}

    ...
}
Events themselves are fairly straightforward. For example, our DNS probe has an event with just the network namespace id (netns), process id (pid), and the raw packet data. We also have an unmarshalling function to convert the raw bytes from the kernel into our structure.
type Event struct {
	Netns uint64
	Pid  uint32
	Pkt  [4084]uint8
}

func (e *Event) Unmarshal(buf []byte, order binary.ByteOrder) error {
	if len(buf) < 4096 {
		return fmt.Errorf("expected input too small, len([]byte) = %d", len(buf))
	}

	e.Netns = order.Uint64(buf[0:8])
	e.Pid = order.Uint32(buf[8:12])
	copy(e.Pkt[:], buf[12:4096])

	return nil
}
Initially, we used encoding/binary to unmarshal. However, after profiling, we unsurprisingly discovered that significant CPU time was devoted to unmarshalling. This prompted us to create a custom unmarshalling procedure in lieu of reflection-based unmarshalling. Benchmark improvements validated this decision and helped us to keep BPFAgent lightweight.
pkg: github.com/doordash/bpfagent/pkg/tracing/dns
cpu: Intel(R) Core(TM) i9-8950HK CPU @ 2.90GHz
BenchmarkEventUnmarshal-12          8289015       127.0 ns/op         0 B/op     0 allocs/op
BenchmarkEventUnmarshalReflect-12     33640       35379 ns/op      8240 B/op     3 allocs/op
Now, let’s address the eBPF probes themselves. Most are kprobes, which provide optimized access to trace Linux syscalls. With kprobes, we can intercept specific syscalls and retrieve the provided arguments and execution context. Previously, we used fentry versions of the probes. But because we are adopting ARM-based Kubernetes nodes, we switched to kprobe because our current Linux kernel version does not support optimized fentry probes on ARM architecture.
For network monitoring, our probes capture the following events of interest:
- DNS
- kprobe/skb_consume_udp
- TCP
- kprobe/tcp_connect
- kprobe/tcp_close
- Exit
- tracepoint/sched/sched_process_exit
To capture the DNS query and response, the skb_consume_udp probe allows us to intercept UDP packets because most DNS traffic is over UDP.
struct sock *sk = (struct sock *)PT_REGS_PARM1(ctx);
struct sk_buff *skb = (struct sk_buff *)PT_REGS_PARM2(ctx);

// ...

evt->netns = BPF_CORE_READ(sk, __sk_common.skc_net.net, ns.inum);

unsigned char *data = BPF_CORE_READ(skb, data);
size_t buflen = BPF_CORE_READ(skb, len);

if (buflen > MAX_PKT) {
  buflen = MAX_PKT;
}

bpf_core_read(&evt->pkt, buflen, data);
The skb_consume_udp has access to both the socket and socket buffer as shown above. We can then use helper functions like BPF_CORE_READ to read the desired data from the structures. These helpers are especially important because they enable use of the same compiled probe across multiple Linux versions and can handle any relocation of data in memory cross-kernel versions.
For TCP, we use two probes to track when a connection is initiated and when it is closed. For connection creation, we probe tcp_connect which handles both TCPv4 and TCPv6 connections. This probe is mainly used for stashing a reference to the socket for basic context information about the connection source.
struct source {
  u64 ts;
  u32 pid;
  u64 netns;
  u8 task[16];
};

struct {
  __uint(type, BPF_MAP_TYPE_LRU_HASH);
  __uint(max_entries, 1 << 16);
  __type(key, u64);
  __type(value, struct source);
} socks SEC(".maps");
To emit a TCP connection event, we await the tcp_close call associated with the connection established by tcp_connect. Using bpf_map_lookup_elem, we use the`struct sock * as our key. We did this because contextual information from bpf’s helpers like bpf_get_current_comm() was not always accurate in the tcp_close probe.
struct sock *sk = (struct sock *)PT_REGS_PARM1(ctx);

if (!sk) {
  return 0;
}

u64 key = (u64)sk;

struct source *src;

src = bpf_map_lookup_elem(&socks, &key);
When capturing the connection close event, we include how many bytes were sent and received over the connection. For this, we cast the socket to either tcp_sock (TCPv4) or tcp6_sock (TCPv6) based on the socket’s network family. This is possible because these structures contain the extended TCP statistics described in RFC 4898.
u16 family = BPF_CORE_READ(sk, __sk_common.skc_family);

if (family == AF_INET) {
  BPF_CORE_READ_INTO(&evt->saddr_v4, sk, __sk_common.skc_rcv_saddr);
  BPF_CORE_READ_INTO(&evt->daddr_v4, sk, __sk_common.skc_daddr);

  struct tcp_sock *tsk = (struct tcp_sock *)(sk);

  evt->sent_bytes = BPF_CORE_READ(tsk, bytes_sent);
  evt->recv_bytes = BPF_CORE_READ(tsk, bytes_received);
} else {
  BPF_CORE_READ_INTO(&evt->saddr_v6, sk, __sk_common.skc_v6_rcv_saddr.in6_u.u6_addr32);
  BPF_CORE_READ_INTO(&evt->daddr_v6, sk, __sk_common.skc_v6_daddr.in6_u.u6_addr32);

  struct tcp6_sock *tsk = (struct tcp6_sock *)(sk);

  evt->sent_bytes = BPF_CORE_READ(tsk, tcp.bytes_sent);
  evt->recv_bytes = BPF_CORE_READ(tsk, tcp.bytes_received);
}
Lastly, we have a tracepoint probe for tracking when processes exit. Tracepoints are added by kernel developers to hook into specific events that occur within the kernel. They are designed to be more stable than kprobes because they don’t need to be tied to specific syscalls. This probe’s events are used to evict data from in-memory caches.
Each of these probes is compiled by Clang in our CI pipeline using cilium/ebpf`’s code generation.
All these raw events must then be enriched with identifying information to be useful. We use the fact that BPFAgent is a Kubernetes daemonset deployed in the node’s process ID namespace to directly read a process’ cgroup from /proc/:id/cgroup. Because most processes running on the node are Kubernetes’ pods, most cgroup identifiers look something like this:
/kubepods.slice/kubepods-pod8c1087f5_5bc3_42f9_b214_fff490864b44.slice/cri-containerd-cedaf026bf376abf6d5c4200bfe3c4591f5eb3316af3d874653b0569f5208e2b.scope. From this convention, we extract the pod’s UID (between /kubepods-pod and .slice) as well as the container ID (between cri-containerd- and .scope).
With these two IDs, we can inspect our in-memory cache of Kubernetes pod information to find the pod and container to which a connection was bound. Each event is annotated with the container, pod, and namespace name.
Ultimately, the DNS events described previously are decoded using the google/gopacket library. With the decoded packets, we export events that include DNS query type, query question, and response code. During this processing, we use the DNS data to create in-memory cache mapping (netns, ip) to (hostname). This cache is used to further enrich the destination IPs from our TCP events with the likely hostname associated with the connection. A simple IP-to-hostname lookup is not practical because a single IP may be shared by multiple hostnames.
The data exported by BPFAgent is then sent to our observability Kafka cluster, where each data type is assigned its own topic. The data is then ingested in large batches into a ClickHouse cluster. From there, teams can interact with the data via Grafana dashboards.
Subscribe for weekly updates
Benefits of using BPFAgent
While the data described up to this point has been helpful, eBPF data has really shined in its ability to provide insights independent of our deployed applications. Here are some examples of how DoorDash teams are using BPFAgent data:
- Our storage team has used the data to investigate shared databases during our push toward single-service ownership. Using the TCP connections, they could filter by common database ports such as 5432 for PostgreSQL and then aggregate by destination hostname and Kubernetes namespace to detect databases used in multiple namespaces. The data allowed them to avoid combining a variety of different service-emitted metrics that might have unique naming conventions.
- Our traffic team has used the data to detect hairpin traffic, the internal traffic that exits our virtual private cloud before re-entering from the public internet, incurring additional costs and latency. BPF data allowed us to quickly find and internal traffic targeting external-facing host names like api.doordash.com. Once we were able to remove this traffic, our team was then able to confidently set up traffic policies forbidding future hairpin traffic.
- Our compute team has used DNS data to better understand large spikes in DNS traffic. Although they previously had node-level DNS traffic metrics, it was not broken down by specific DNS question or source pod. With BPF data, they are able to find the bad-acting pods and work with our teams to optimize DNS traffic.
- Our product engineering teams have used the data to support a migration to our market-sharded Kubernetes clusters. This migration required the adoption of our Consul-based service discovery by all a service’s dependencies. BPF data was a crucial source of truth highlighting any unexpected interactions and validating that all clients had moved to the new service discovery method.
Conclusion
Implementing BPFAgent has allowed us to understand service dependencies at the network layer and enabled better control of our microservices and infrastructure. We have been thrilled with new insights, prompting us to expand BPFAgent to include additional use cases beyond network traffic monitoring. Among the first up: Building probes to capture file system reads from our shared configuration volume, driving best practices across all applications.
We look forward to onboarding more use cases and pushing the platform to support performance analysis and on-demand probes in the future. We also hope to explore new types of probes and any new hooks the Linux kernel team creates to help developers gain more insight into their systems.
Acknowledgements
BPFAgent was built by many hands here at DoorDash. I would especially like to acknowledge Matt Ranney, Matt Zimmerman, Qixuan Wang, Hochuen Wong, and Luigi Tagliamonte for their contributions to the service.


