Product demo.
  What is data observability?
  What is a data mesh--and how not to mesh it up
  The ULTIMATE Guide To Data Lineage
 Experimentation: How Data Leaders Can Generate Crystal Clear ROI

Shane Murray
Shane is Field CTO of Monte Carlo. Previously, he served as the SVP of Data & Insights at The New York Times.

Chetan Sharma
Chetan Sharma is the CEO of Eppo, the only warehouse-native experimentation platform. He was one of the first data scientists at Airbnb.
Have you ever stood in the slide projector’s glow and pitched furrowed brow executives a change that could swing millions in revenue? Or flip the mission of hundreds of employees?
Shane and his data team navigated journalistic, product and business interests to fine tune the New York Times pay model. This highwire act helped transition the Gray Lady from an ad revenue to subscriber driven publication.
Chetan and team dealt an existential blow to Airbnb’s “Neighborhoods” travel guide, a feature that had commanded considerable resources to produce and was originally championed by CEO Brian Chesky. The decision to deprioritize its user exposure dramatically boosted incremental bookings.
What we can tell you from these, and other, experiences is driving large scale change requires a level of conviction that only comes from well run experiments that prove a change will lead to a more favorable business outcome. Or nearly psychopathic self-confidence.
These sweaty palm decisions are among the most visible contributions, but smaller non-controversial experiments can make just as large an impact. The most valuable experiment ever conducted during Chetan’s time at Airbnb was having a listing’s details open in a new window when clicked. No executive’s brows were furrowed during the production of that code.
Experimentation is a means for data teams to demonstrate strong, easily quantifiable value. As Chetan likes to say, “You’re plugged directly into the outcome of a decision. You have the receipts.”
Yet despite the increasingly urgent demand for data teams to start producing their receipts, robust experimentation programs are typically concentrated within product led growth (PLG) companies, performance marketing teams, or large tech giants. More ink is spilled on machine learning applications and dashboards than on A/B tests and p-values.
Drawing on lessons from our journey, this post will explore practical strategies for establishing a data-driven culture of experimentation across an organization such as:
- Building internal capacity;
- Establishing a north star;
- Navigating tradeoffs;
- Avoiding pitfalls; and
- How to get started;
Building Internal Capacity: “Fielding A Team”

To quote A League of Their Own’s Jimmy Dugan, “If it wasn’t hard then everyone would do it.” One of the biggest obstacles to creating a data experimentation regime that gets results is the dearth of talent and experience.
The Googles and LinkedIns of the world may employ software engineering unicorns who also boast a deep knowledge of statistics and causal inference. Most people however, don’t play for the Yankees.
Few of the people typically involved in experiments, outside of some data scientists and analysts, are likely to have revisited their AP Statistics textbook. They are more than capable, but typically an initial investment needs to be made to empower them either by acquiring expertise for a center of excellence, training, or technology.
At the New York Times, Shane made a deliberate effort to hire people with quantitative skills that could mentor others. Airbnb’s experimentation program grew from ex-Googlers attempting to increase search rankings to experimentation being core to nearly every product decision as successful experimenters were celebrated and promoted.
This democratization is crucial because the ROI of experimentation is highly correlated with the volume and diversity of experiments being conducted. Those closest to business operations often have the best hypotheses to test.
When onboarding and training “low statistical context” users, removing friction is key. It can’t take a week and a half plus a Github review to add a metric. Asking them to understand how to read from Jupyter notebooks one day and Excel spreadsheets the next is not a recipe for success. An experimentation interface has to be purposeful, intuitive, and consistent.
Establishing A North Star: “The Moneyball Metric”
To continue the baseball analogy, one of the biggest catalysts for Billy Beane’s famous “moneyball” team was unlocking their north star metric. In this case, it was optimizing for on-base percentage rather than batting average (like the rest of the league at the time).
Experimentation programs’ winning streaks start when there is a clear north star metric. In the case of Airbnb it was incremental bookings. For the New York Times it was the lifetime value of a subscriber.
Why is this so important? It enables more teams to conduct meaningful experiments independently. You don’t have to be prescriptive on the exact route to take when there is a clear commander’s intent.
A north star metric also lets you compare the impact of different experiments. For example :
- The translation layer for the Chinese version of Airbnb drove bookings, but not as much as…
- The search ranking model, which didn’t drive as much impact as..
- Urgency messaging saying that an Airbnb listing was a rare find.
Identifying and gaining consensus on a north star metric is easier said than done. Ideally, data leaders should work closely with executives to do this before the heavy lifting starts.
In some cases, it may be the experimentation process, and the tradeoffs it forces, that make formerly hypothetical questions around north stars more real and urgent.
Navigating Tradeoffs: “Framing The Strike Zone”
Speaking of tradeoffs, it’s important to realize that any time you are optimizing for a behavior you are, by definition, discouraging others. In the process of democratizing data experimentation it’s important to set guardrails for what types of experiments are outside the strike zone.
For example, following user visits with aggressive email campaigns would likely have led to more incremental bookings at Airbnb. However, the user’s inbox and other parts of the user experience (like avoiding adversely impacting the star rating) were considered sacrosanct because they would have fundamentally impacted the company brand. Velocity is important, but you never want to experiment with your core identity.
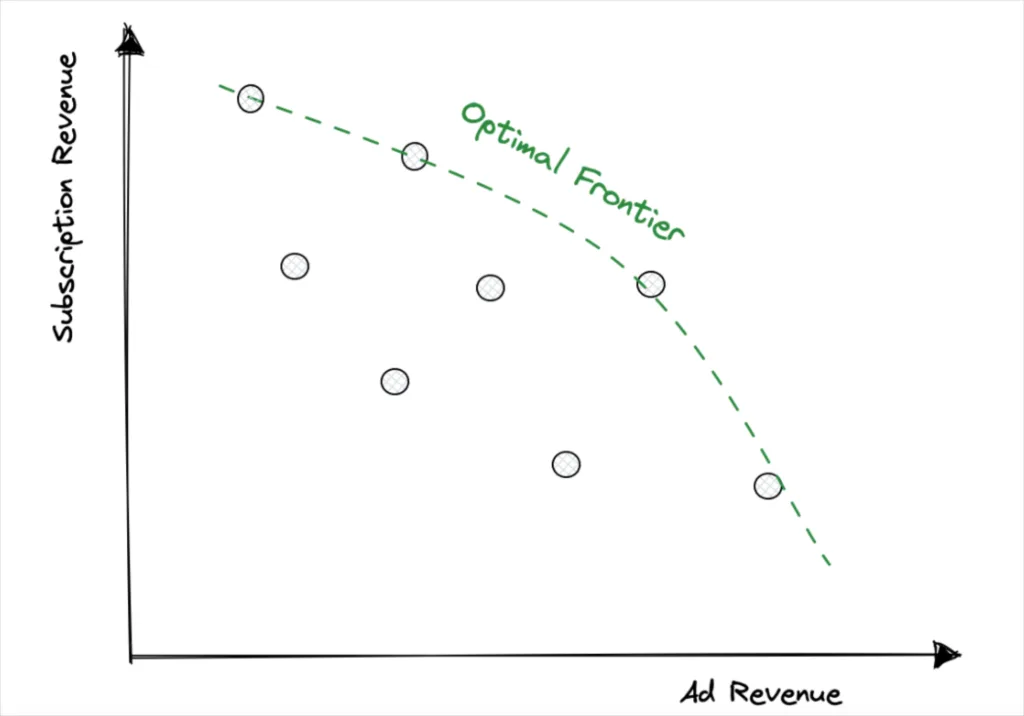
In a large organization like the New York Times, it’s inevitable that you’ll have different teams (or departments) seeking to improve different metrics through experimentation. For example, media companies are regularly experimenting with tactics to increase signup or subscription, which may come at the expense of further engagement and advertising revenue, at least in the near-term.
It can be helpful to establish a principle that teams can freely maximize their target metric so long as it does not significantly decline an important counter metric (these metrics should be narrowly defined rather than exhaustive).
For experiments where there is a clear metric trade-off, align executives on a decision criteria up front. While you may not achieve complete alignment, at least you’ve set the stage for a successful experiment.
Finally, create an “optimal frontier” based on the experiment results that clearly articulates the trade-off to be made. With the evidence on the table of the best set of options, and the avoidance of inefficient options, you’ll have a better shot at a decision even in the most consensus-driven cultures.
Avoiding Pitfalls: “Creating A Level Playing Field”
Your program will not be successful if you don’t create a fair and level playing field for your experiments. At both the New York Times and Airbnb, considerable resources were invested in developing strong experimentation design and data infrastructure to avoid problems like:
- Improper randomization– Many teams will attempt to randomize their control and variable groups by using problematic methods such as using the last number in the user ID. Shane had one experiment fail because an ad hoc method of randomization was systematically biasing toward more frequent users. He likes to say, “you can’t leave randomization to chance.” Data teams need a well-designed and consistent method of random assignment.
- Product bugs in diverse user bases– Companies have user bases that are much more diverse than they think. They span languages, time zones, subscription plans, device types, screen sizes, internet latencies. It’s very difficult to design for every user’s context. Experimentation reveals when one of those bugs or misses is going to undo any positives that you might have accomplished.
- Data silos– Experiments are also great at surfacing the gaps and silos in your data infrastructure. Very often, you are breaking new ground with an experiment, and will identify systems that are incapable of serving the new experience, or issues with delivering a consistent experience across platforms or surfaces.
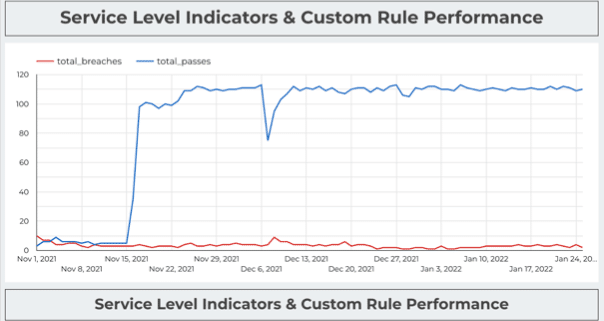
- Data quality– Statistical significance is a fragile thing. If you experience data freshness issues or other data anomalies because your data pipelines broke during an experiment, all the effort that has been invested is for naught.
Unfortunately, bad data is particularly likely to strike during periods of product change that involve multiple simultaneous changes to instrumentation. This is potentially disastrous given how experiments are highly scrutinized; after all, painstakingly crafted code and promotions are often on the line.
Clearing this bar requires a high degree of data trust. It’s hard to convince departments to launch experiments or executives to trust them if no one believes in the underlying data or the dashboards they look at every day. Oftentimes these ETL systems come under considerable pressure as all of your stakeholders want to look at every metric a million different ways with sub second latency.
- Metric management– The curation and massaging of a central metrics store is foundational to an experiment program. The metrics layer requires constant addition, pruning, and governance. This can be time intensive, but it can be greatly expedited in a modern data stack with tools built to integrate natively with the warehouse.
Getting Started: “Don’t Start Swinging For The Fences”
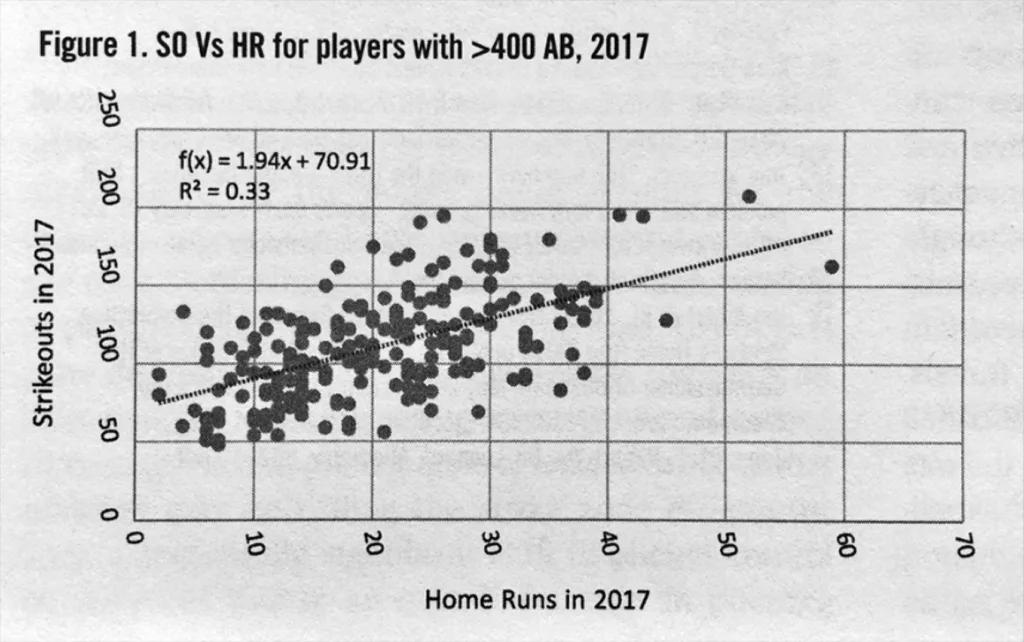
Home run hitters can be game changers, but they strike out a lot. When you are starting to build operational muscle around your experimentation program, it’s better to be Ichiro than Mark McGwire.
Avoid experiments on products that take a long time to develop. These will inherently be more political due to the real and emotional investment made by the business.
Instead, aim to get a lot of at-bats. Your first few experiments will serve as a kind of spring training. They will reveal many of the context and infrastructure challenges mentioned in the previous section.
To build up quick wins and momentum, one of the first places to start is by scheduling a conversation with someone who was with the company when it found product market fit. Even if it wasn’t formalized, they were running constant experiments and changing the product to determine what levers led to adoption and growth. They will have a strong, intuitive understanding of the channels that get users hooked.
Then conduct a complete walk through of how users experience a product. At this point, you are mostly going to be looking at removing friction points or reducing large prominent elements on screen (unless there is rock solid rationale). Experimentation design should start with simple A/B tests rather than more complex Bandit approaches.
Once you’ve gotten a few singles and ground-rule doubles, now it’s time for the home run derby.
Reaching this stage is important because while velocity and iterative learning is critical, you can’t iterate your way to a new business model.
Too often experiments in large organizations are constrained by what’s possible in the current user experience or what is controllable by a single product team, while the task at hand might be to reimagine what the experience could be.
The narrow mandate of product teams and the lack of good methodology can lead to what are effectively bunts, that are barely discernible from random noise. Bigger swings require teams to think beyond their own scope and define hypotheses that fundamentally alter the user experience and business model.
What’s Hard Is What Makes It Great
Data teams cannot afford to wait to build great experimentation programs.
It is an abdication of responsibility to solely be involved in the dashboard creation process and put the onus entirely on business stakeholders to naturally experiment with their tactics and interpret the results.
The experience of the largest and best experimentation teams have shown that about one-third of experiments will be positive while one-third will be negative. If data teams don’t step up to the experimentation plate to call the balls and strikes, then it will be the organization that is striking out.
Interested in how you can get your experimentation program off the ground? Check out Eppo.
Interested in leveraging data observability to establish highly reliable data systems? Fill out the form below to schedule a time to speak with us!
Our promise: we will show you the product.
Read more posts.