12 Essential Commands for Streamlit
Learn about the most commonly used Streamlit commands and build a customized web application.
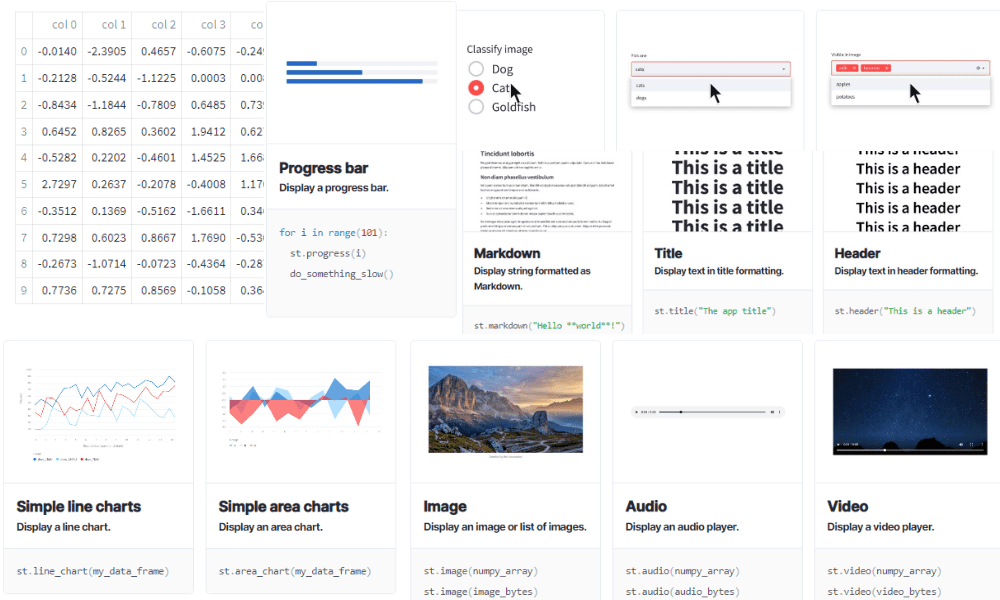
Image by Author
1. write
st.write is more than a print function to display text and numbers. You can use it to display pandas DataFrames, errors, dictionaries, interactive visualization, and Keras models.
st.write(*args, unsafe_allow_html=False, **kwargs)
Just like print you need to provide either string/numbers or object.
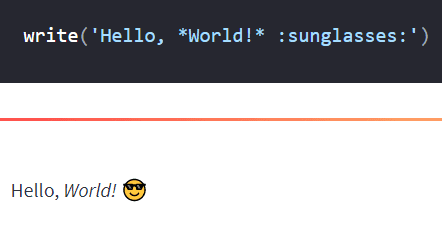
Image from Streamlit API reference
Note: you can also use st.title, st.header, st.header, st.code, and st.latex to display various types of text elements.
2. markdown
If you are comfortable with Markdown, then st.markdown is your best friend. It will help you display images, text, headings, and everything else.
st.markdown(body, unsafe_allow_html=False)
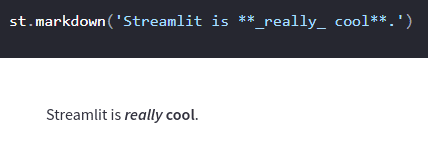
Image from Streamlit API reference
3. dataframe
You can use st.dataframe display pandas DataFrame and Styler, pyarrow table, NumPy array, PySpark DataFrame, and Snowpark DataFrame and Tables. The function provides you to customize the table by allowing you to adjust width and height, and style using pandas styler.
st.dataframe(data=None, width=None, height=None, *, use_container_width=False)
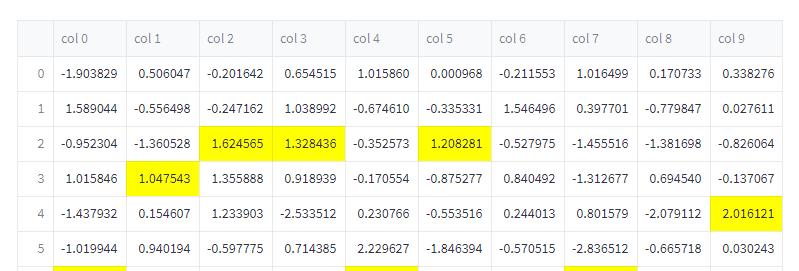
Image from Streamlit API reference
4. metric
If you have created a dashboard, you will know the importance of displaying KPIs and crucial performance metrics.
The st.metric command makes it easy to display all kinds of metrics with the delta indicator. You can also use st.columns to display multiple metrics.
st.metric(label, value, delta=None, delta_color="normal", help=None)

Image from Streamlit API reference
5. line_chart
Streamlit also has its visualization command that is syntax-sugar around st.altair_chart. You can use st.line_chart to display a line chart within a few seconds. It is much easier to use than st.altair_chart as it uses the data's column and indices to figure out the chart's spec.
st.line_chart(data=None, *, x=None, y=None, width=0, height=0, use_container_width=True)
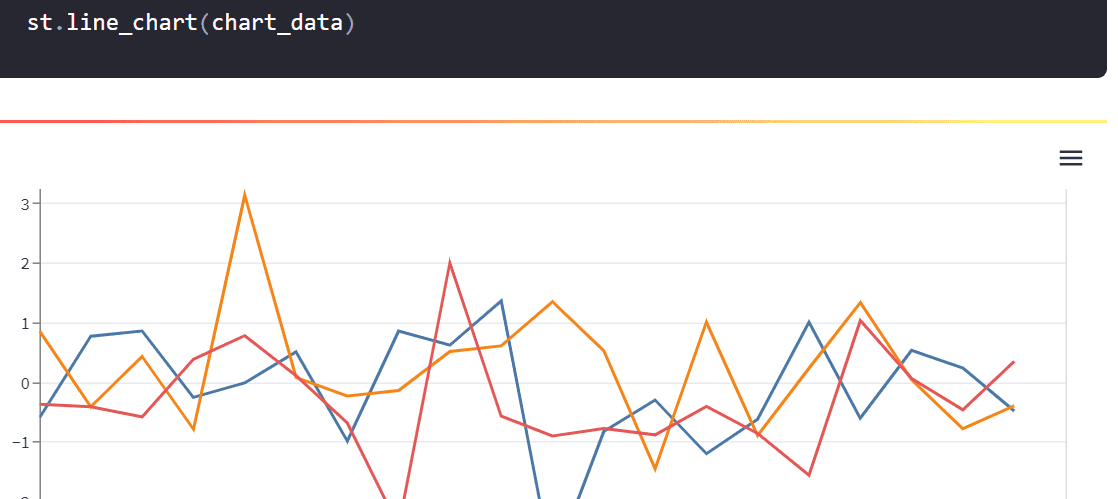
Image from Streamlit API reference
6. matplotlib
st.pyplot displays matplotlib.pyplot figures. You can use it to display all kinds of graphs and customize them just like you do in the Jupyter Notebook.
st.pyplot(fig=None, clear_figure=None, **kwargs)

Image from Streamlit API reference
Note: you can also use st.altair_chart, st.vega_lite_chart, st.plotly_chart, st.pydeck_chart, st.graphviz_chart, and st.map to display interactive visualization for your webapp.
7. text_input
st.text_input displays a single-line text input widget. You can use it to provide user inputs to the function and make your web application interactive and customizable. It is usually used for NLP and machine learning tasks.
st.text_input(label, value="", max_chars=None, key=None, type="default", help=None, autocomplete=None, on_change=None, args=None, kwargs=None, *, placeholder=None, disabled=False, label_visibility="visible")

Image from Streamlit API reference
8. selectbox
Apart from the input text, you can use the st.selectbox widget and provide options to the user. It will improve the user experience, as they can play around by selecting various options.
st.selectbox(label, options, index=0, format_func=special_internal_function, key=None, help=None, on_change=None, args=None, kwargs=None, *, disabled=False, label_visibility="visible")
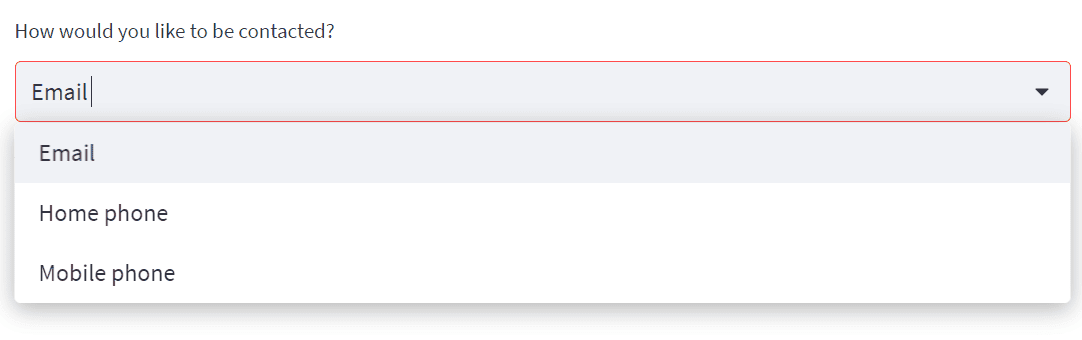
Image from Streamlit API reference
Note: you can also use st.button, st.download_button, st.checkbox, st.radio, st.slider, st.number_input, st.text_area, st.date_input, st.time_input, st.file_uploader, st.camera_input, and st.color_picker as input widget.
9. image
To display the image, you need to open the image using PIL and provide the object to the st.image. The functions take Numpy ndarray to display all kinds of images.
st.image(image, caption=None, width=None, use_column_width=None, clamp=False, channels="RGB", output_format="auto")
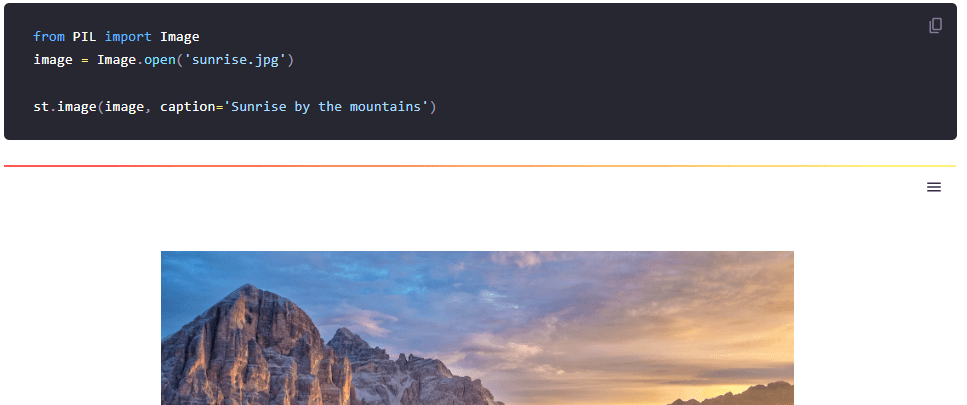
Image from Streamlit API reference
Note: you can also listen to audio and watch video using st.audio and st.video.
10. progress
st.progress is an amazing thing. Instead of waiting for an unknown period, you can estimate time by looking at the progress bar. It improves your user experience.
st.progress(value)
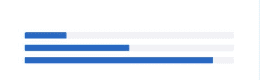
Image from Streamlit API reference
Note: you can also use status elements to display spinner, warnings, error, info, success, and exception.
11. sidebar
The st.sidebar is part of customizing layouts and containers. It is used for analytics and machine learning applications. It also provides you will more room to add options for users.
with st.sidebar:
    st.[element_name]
Image from Streamlit API reference
Note: you can also use Layouts and Containers to customize tabs, containers, columns, and expander.
12. cache
The st.cache is your best friend when it comes to working with large datasets and machine learning models. It is a function decorator to memoize function executions and save you time.
st.cache(func=None, persist=False, allow_output_mutation=False, show_spinner=True, suppress_st_warning=False, hash_funcs=None, max_entries=None, ttl=None)
@st.cache(persist=True)
def fetch_and_clean_data(url):
    # Fetch data from URL here, and then clean it up.
    return data
Conclusion
You can use these commands to create a data analytics dashboard, machine learning demo, web applications, or even create your portfolio websites. And if you are looking for inspiration, have a look at the Gallery of apps created and shared by the community.
In this post, we have covered the 12 most essential Streamlit commands and if you want to learn about all of them, check out Streamlit Cheat Sheet. We have learned about text, DataFrames, visualization, metrics, input and widgets, layouts, and utility commands.
If you like my work, do share it on social media, or if you have questions regarding Streamlit, you can reach me on LinkedIn.
Abid Ali Awan (@1abidaliawan) is a certified data scientist professional who loves building machine learning models. Currently, he is focusing on content creation and writing technical blogs on machine learning and data science technologies. Abid holds a Master's degree in Technology Management and a bachelor's degree in Telecommunication Engineering. His vision is to build an AI product using a graph neural network for students struggling with mental illness.