Loss Functions: An Explainer
A loss function measures how wrong the model is in terms of its ability to estimate the relationship between x and y. Find out about several common loss functions here.
Loss function is a method that evaluates how well the algorithm learns the data and produces correct outputs. It computes the distance between our predicted value and the actual value using a mathematical formula.
In layman's terms, a loss function measures how wrong the model is in terms of its ability to estimate the relationship between x and y.
Loss functions can be categorized into two groups:
- Classification - which is about predicting a label, by identifying which category an object belongs to based on different parameters.
- Regression - which is about predicting a continuous output, by finding the correlations between dependent and independent variables.
Below is a list of types of loss functions for both Classification and Regression tasks.
Cross Entropy
Cross Entropy and Log Loss measure the same thing, however they are not the same and is used for Classification tasks. Cross Entropy measures the difference between two probability distributions for a given random variable or set of events.
Types of Cross Entropy:
Binary Cross Entropy - used for binary tasks
- Categorical Cross Entropy - used for both binary and multiclass tasks. This types of Cross Entropy requires the label to be encoded as categorical. For example; one-hot encoding for 3 classes will use this representation: [0, 1, 0], [1,0,0]…)
- Sparse Cross Entropy: - used for both binary and multiclass tasks. This types of Cross Entropy requires the label to be an integer; 0 or 1 or n
Code for Cross Entropy:
def CrossEntropy(yHat, y):
    if y == 1:
      return -log(yHat)
    else:
      return -log(1 - yHat)
Log Loss
Log Loss, the binary of Cross Entropy is used in Classification tasks. It measures the performance of a classification model, where the output is a probability with values between 0 and 1.
As the predicted probability gets further away from the actual label, Log loss increases. In the ideal world, a perfect model would have a Log Loss of 0.
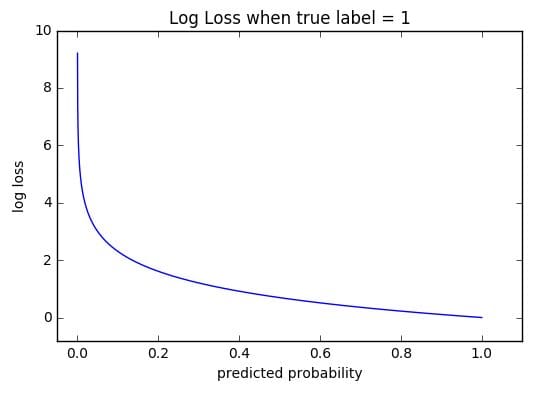
Source: ml-cheatsheet
In the image above, you can see that as the predicted probability reaches 1, the Log Loss decreases. On the other hand, you can see that as the predicted probability decreases, the Log Loss rapidly increases.
Log Loss Using Scikit-learn
from sklearn.metrics import log_loss:

LogLoss = log_loss(y_true, y_pred, eps = 1e-15,
    normalize = True, sample_weight = None, labels = None)
Hinge
Hinge is a loss function used for Classification tasks. This type of loss function incorporate a margin from the classification boundary against a loss. Hinge penalises misclassfied samples aswell are classifying one that are within the defined margin from the decision boundary correctly.
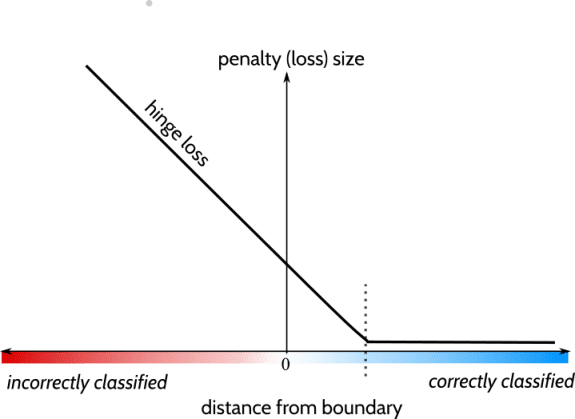
Source: StackOverflow
- The x-axis represents the distance from the boundary
- The y-axis represents the loss size, or the penalty the function will incur.
The dotted line on the axis represents 1, which means when an instance’s distance from boundary is more than 1, the loss size is 0. If the distance from boundary is at 0, the loss size is 1.
Correctly classified data points will have a low or 0 loss size; a low hinge loss. Whereas incorrectly classified data points will have a high or loss size of 1; a high hinge loss.
Hinge Loss Code
def Hinge(y_pred, y_true):
   return np.max([0., 1. - y_pred * y_true])
Mean Square Error Loss
Mean Square Error Loss is also known a L2 regularization and is used for Regression tasks. It tells you how close a regression line is to a set of data points.
It calculates the square difference between the current output and the expected output divided by the number of output. However, Mean Square Error loss is more sensitive to outliers due to using the square difference.
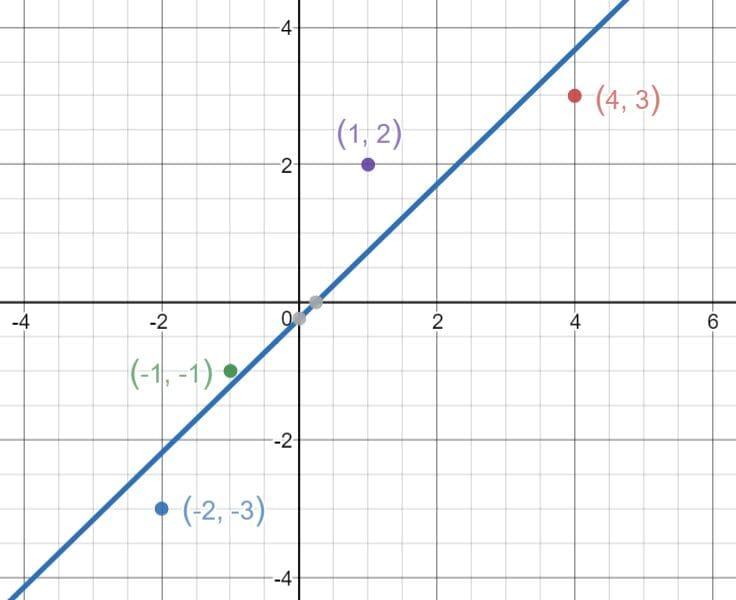
Source: freecodecamp
Mean Square Error Loss Code
def mean_square_error(y_true, y_pred):
   return K.mean(K.square(y_true-y_pred), axis=-1)
Mean Absolute Error Loss
Mean Absolute Error is also known as L1 regularization and is used for Regression tasks. It computes the mean of squares of errors between labeled data and predicted data.
It calculates the absolute difference between the current output and the expected output divided by the number of output. It’s aim is to minimise this absolute differences. Mean Absolute Error is not sensitive towards outliers as it is based on absolute value, unlike Mean Square Error.
In order to calculate the Mean Absolute Error, you need to take the difference between your model’s predictions and the actual labelled outputs. You then apply the absolute value to the difference, and then average it out across the whole dataset.
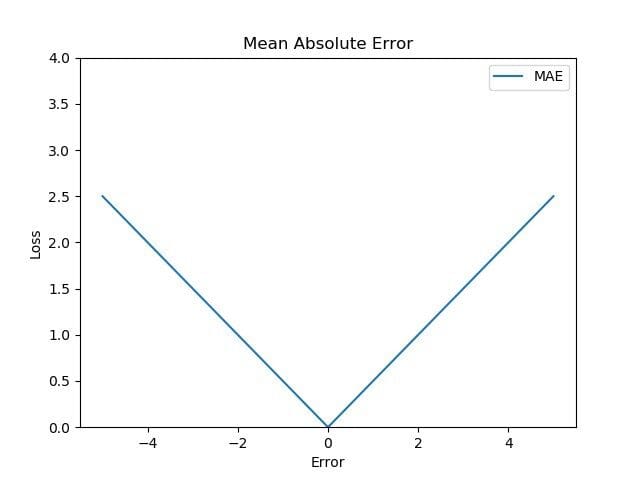
Source: TowardDataScience
Mean Absolute Error Code
def mean_abc_error(y_true, y_pred):
   return K.mean(K.abs(y_true-y_pred), axis=-1)
Huber Loss
Huber Loss is a combination of Mean Absolute Error and Mean Square Error. However, the different is that it is influenced by an additional parameter called delta (δ).
It is a combination of both as it tells us for loss values which are less than delta; use the Mean Square Error. For loss values which are greater than delta, use the Mean Absolute Error.
In the below image, Mean Absolute Error is in red, Mean Square Error is in blue, and Huber Loss is in green.
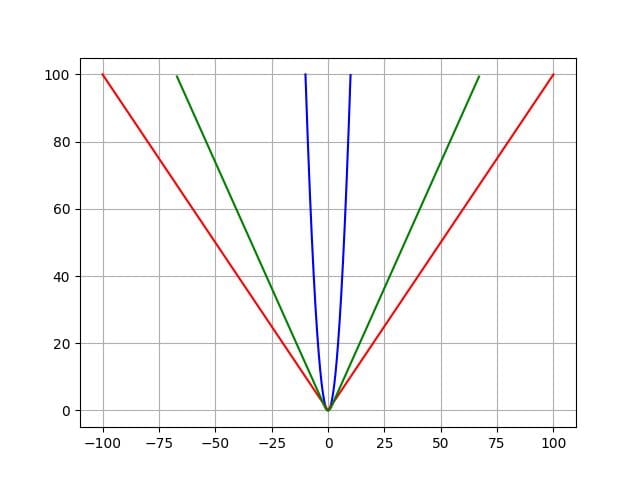
Source: TowardsDataScience
Huber Loss Code
def Huber(yHat, y, delta=1.):
    return np.where(np.abs(y-yHat) < delta,.5*(y-yHat)**2 , delta*(np.abs(y-yHat)-0.5*delta))
Conclusion
I have briefly gone over 3 loss functions for Classification and Regression each. However, there are many more that you can explore.
Below is an image showing a list of different types of loss functions for Classification and Regression tasks.
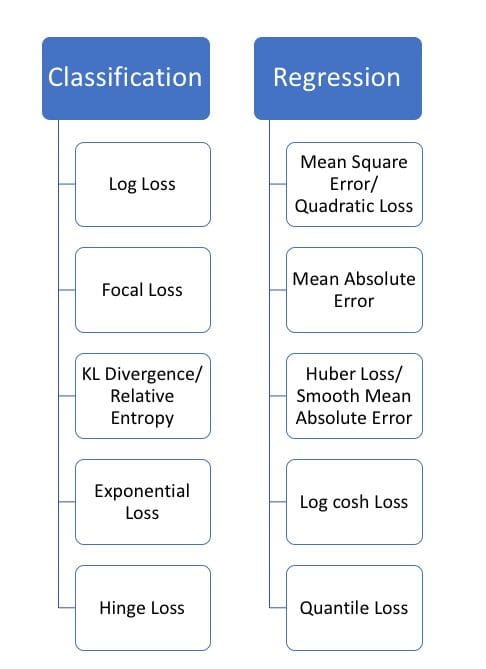
Source: Heartbeat
Nisha Arya is a Data Scientist and Freelance Technical Writer. She is particularly interested in providing Data Science career advice or tutorials and theory based knowledge around Data Science. She also wishes to explore the different ways Artificial Intelligence is/can benefit the longevity of human life. A keen learner, seeking to broaden her tech knowledge and writing skills, whilst helping guide others.