Changing Seas
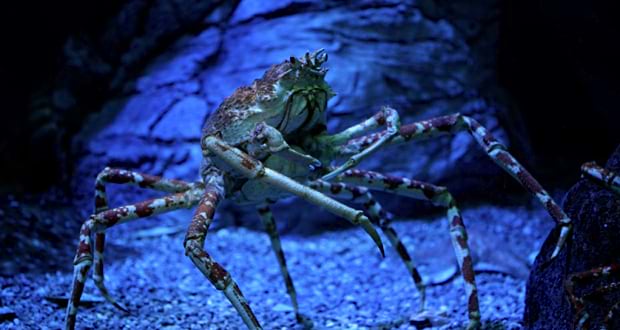
In 2022, more than a billion snow crabs disappeared from the Bering sea, and it’s thought that warming oceanic conditions could be the cause. For years the effects of climate change have become increasingly apparent: in the 2020s increasingly intense wildfire and hurricane seasons, drought, and species die-offs seem to make regular headlines. Indeed, awareness of the negative effects of the climate crisis is now widespread, and a majority of us now believe that more must be done to mitigate these effects. Smart climate policy requires more than just consensus however, we need informative, data-driven decision-making tools to precinct, assess, and decide how we can collectively move to a more sustainable future.
If you had to guess the fate of a sensitive species in response to climate change, your response might (rightfully) be that the story doesn’t end well, or at least isn’t going in a good direction. It’s one thing to say in a general sense ‘climate change is bad’, but smart planning requires more specificity and rigor than that. To answer this question, you might start by understanding where crabs like to live today, and where those areas are likely to be in the future. Fortunately, The National Oceanographic and Atmospheric Administration (NOAA) is doing the work today to gather those data and implement the best science to meet the ever-intensifying challenges of climate change.
A Data-Driven Response
Ecological Forecasting
In the case of snow crab fisheries, it will be critical to understand how climate change may affect the distribution and suitability of crab habitat. To do so, we used NOAA data to train a machine learning maximum entropy model on snow crab presence data and baseline (1980-2014) historic oceanic conditions to determine the baseline/current suitable snow crab habitat—where snow crabs like to live given ‘normal’ oceanic conditions today. We then evaluated that model on the same factors predicted to the end of the century under several different climate scenarios (2.6, 4.5, 7.0, 8.5) to see how climate changes will affect snow crab habitat suitability over a broad time horizon. Our results show that climate change will have a significant, noticeable, and deleterious effect on suitable crab habitat, but that the results are dependent on the degree of change: more moderate climate scenarios predicably lead to less decline than more intense ones, further evidence of the need to mitigate the effects of climate change in the coming years.
Data Sources
To do this kind of analysis we need information about the current distribution of crabs in the ocean, as well as climate data for both historical and future periods. Fortunately, NOAA provides both through their open data portals. Snow crab distribution data come from NOAA Fisheries’ Distribution Mapping and Analysis Portal (DisMAP), which provides visualization tools and data access to survey and distribution data for a wide variety of marine species:

Past and future climate data are sourced from CMIP6: NOAA’s Climate Change Web Portal:
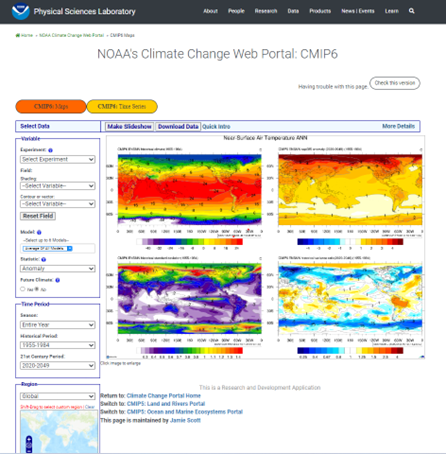
This portal provides a variety of worldwide ocean/climate variables sourced from the Coupled Model Inter-comparison Project (CMIP6), a collection of climate models from NOAA and other contributors that project key bioclimate indicators into the future. These datasets can be easily downloaded in netCDF format and used as direct inputs to further analysis. A visual example of one of these inputs, sea bottom temperature, is shown below, overlaid with snow crab presence data from DisMAP:
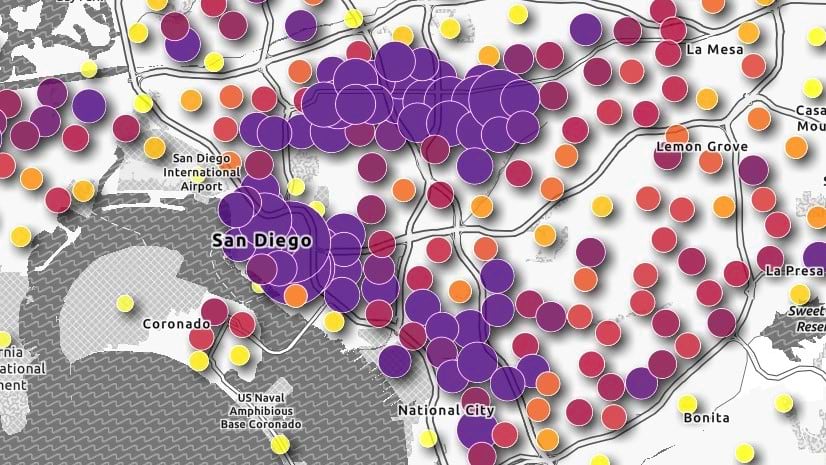
Current Bottom Temperatures and Snow Crab Locations
A web mapping application allowing you to swipe snow crab presence locations on and off with sea bottom temperature as a reference layer.
Here we see point locations where crabs were surveyed, presence is shown in orange, while background points are shown in yellow, overlayed on a baseline sea bottom temperature layer. Visually, we see that crabs tend to be found in the cooler waters of the Bering Sea.
For this analysis, we chose several predictors relevant to benthic organisms–bottom temperature, bottom salinity, sea ice, alkalinity, and primary productivity. NOAA’s climate data portal provides not only historic oceanic and climate data, but those data predicted out to the end of the century at several different time steps and under several different climate change scenarios. These scenarios (2.6, 4.5, 7.0, 8.5), known as Shared Socioeconomic Pathways, represent different degrees of greenhouse gas-forced heating. 2.6 being the most moderate scenario, 8.5 being the most extreme scenario. Compare the baseline temperature and the predicted temperature layers below, and notice how warmer waters move northward into the Bering Sea:
Baseline Temperature vs Future Temperature
A web mapping application allowing you to swipe between baseline historic and future predicted ocean bottom temperatures.
Model Results
After a data transformation/engineering process, we ran our baseline model to find current suitable crab locations. That prediction surface is shown in blue below. Darker colors indicate more suitable conditions, while lighter colors indicate less suitable conditions. Swipe in the app below to see how well the model captures known snow crab locations (shown in orange).
Current Snow Crab Suitability
A web mapping application showing modelled baseline snow crab suitability with snow crab presence location overlayed on top.
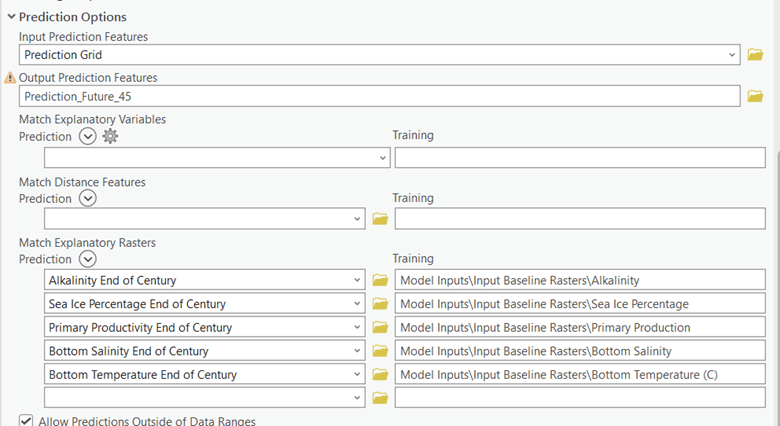
We then ran the same model using predicted environmental variables for all available climate scenarios at the end of century (2070-2099) time step. To do so, we configure the Presence-Only Prediction tool to evaluate our predicted rasters rather than the baseline ones, the matching for which is shown below:
The results are shown in the application below. Swipe though/turn on all the layers and compare the differences between more and less extreme climate scenarios, as well as the deviation from the baseline. What do you notice?
Climate Scenario Suitability Comparison
A web mapping application allowing you to click through modelled results for baseline (historic) and future predicted snow crab suitability under 4 RCP scenarios.
Summary
Hopefully you’ll see that under more extreme climate scenarios suitable crab habitat decreases more than under less extreme ones. Specifically, the loss of suitable areas within the US exclusive economic zone, the area in which the US has exclusive rights to natural resources like fish stocks, is very dependent on the climate scenario chosen. Under the 2.6 scenario, the most moderate, we see significant shifts in snow crab habitat, although there is still a large amount of predicted suitable habitat in the waters near Alaska. Under the most extreme 8.5 scenario, there is almost no suitable snow crab habitat left in the Bering Sea.
More to Consider
Insights like these can be used to inform not only current resource management strategies, but future climate adaptation and planning. But it is also important to keep in mind that these are models. All models have uncertainties and assumptions that can affect the quality and accuracy, and this model is by no means perfect. However, this project does show how available data can be used to anticipate future change, providing a kind of ecological intelligence that can help better prepare for a changing world.
This type of modeling is not specific to crabs: there are hundreds if not thousands of species distributions that can be analyzed this way, and much work remains to be done to understand how climate change will affect the natural world, in the sea and on land. Are you interested in investigating these problems? We encourage you to explore the data and tools mentioned here further, watch the NOAA 2023 User Conference Plenary demonstration linked below, and to stay tuned for more resources on ecological forecasting coming soon.
“It’s not just the data, it’s what we do with it; GIS gives us the what to do with it, the tools to translate and transform our data—to make it matter”
-Mimi DIorio, 2023 UC Plenary
Additional resources to consider
Using Living Atlas content to study current and future threats to global food security (esri.com)
Presence-only Prediction (MaxEnt) (Spatial Statistics)—ArcGIS Pro | Documentation
How Presence-only Prediction (MaxEnt) works—ArcGIS Pro | Documentation
Contributors
NOAA: Dr. Mimi Diorio
Esri: Dr. Lain Graham, Emily Meriam, Dan Pisut, Keith VanGraafeiland.

Article Discussion: