Time Series Forecasting: What, Why, and, How?
Learn time series forecasting with this detailed article that starts with what is time series forecasting and ends with fantastic time series forecasting examples.
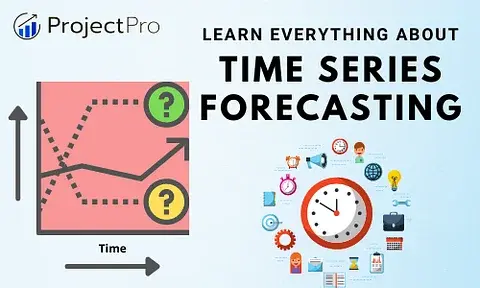
This blog introduces the concept of time series forecasting models in the most detailed form. First, there will be a simple introduction to highlight the significance of such models. Next, you will find a section that presents the definition of a time series forecasting article. After that, you will explore popular time-series-forecasting models. The blog's last two parts cover various use cases of these models and projects related to time series analysis and forecasting problems.
Time Series Project to Build a Multiple Linear Regression Model
Downloadable solution code | Explanatory videos | Tech Support
Start ProjectIf there is one kind of prediction that we all are longing for this year, it has to be: How many covid-19 waves is the world going to witness before we can declare it as endemic? The coronavirus has affected numerous businesses. Thus, many business owners are curious to know when the coronavirus cases are likely to increase for developing efficient strategies. Many prominent institutions like IIT-Delhi have launched unique portals on their websites that model the COVID-19 outbreak. And, if you are wondering what models are helping them in estimating the spread of the virus, the answer lies in understanding time-series forecasting models.
Table of Contents

Time Series Forecasting: Definition, Models, and Projects
This blog will discuss everything about time series forecasting models: what is it, their different types, when do we use them, time series forecasting examples, etc.
What is Time Series Forecasting?
Before exploring different models for forecasting time series data, one should be clear of the time series forecasting definition. A time series refers to a collection of data points whose values can be represented as a function of time. And, when one uses statistical tools over these data points to estimate their values in the future, it is called time series analysis and forecasting. The statistical tools that assist in forecasting a time series are called the time series forecasting models.
New Projects
For example, consider the Australian Wine Sales dataset containing information about the number of wines Australian winemakers sold every month for 1980-1995. The data is available for three different types of wines, namely, red, white, and sparkling. Let us see what the plot for the red wine sales looks like.

Image Source: Introduction to time series and forecasting / Peter J. Brockwell and Richard A. Davis.—2nd ed
If you look closely at the graph, you will notice that the sales are growing on average with time. Additionally, you can see a regular rise in sales around July and going down every January. Thus, if one wants to estimate the sales, say for 1996, they must consider these seasonal trends. Apart from seasonal adjustments, time series forecasting models are used to eliminate background noise, estimate future values, test a hypothesis, predict the values of time series using the values from another, and create simulations for analysis. This blog will explore these use cases with practical time series forecasting model examples. But first, let us understand the various time series forecasting models used by data scientists in their daily lives.
Get Closer To Your Dream of Becoming a Data Scientist with 150+ Solved End-to-End ML Projects
Time Series Forecasting models
These models are used to span the distribution of a time series by assuming the values from a sequence of random variables and the variables obey a probabilistic relationship. This section will first introduce the simplest time series forecasting model and then gradually raise the level of complexity to cover advanced models for forecasting and time series analysis.
Random Walk: Simple Model for Time-Series Analysis and Forecasting,
The easiest way of modeling a time series, is to use the random walk example. It assumes the sequence of events Et is the sum of independent and identically distributed variables x1, x2, x3,..., xt.
Et = x1 + x2 + x3 + … + xt ; where t=1,2,...... and E0 = 0.
To understand it better, consider the case of a man walking down the street who takes a step as per the outcome of a flipped coin. If the coin shows a tail, he takes a step to the right, and if a head shows up, he takes a step to the left. If the coin is unbiased and has an equal probability of landing a head and a tail, the resulting random walk model is referred to as a simple symmetric random walk. Since this is a simple model, it does not take care of any seasons or trends that a time series may have.
Here's what valued users are saying about ProjectPro

Ed Godalle
Director Data Analytics at EY / EY Tech

Ameeruddin Mohammed
ETL (Abintio) developer at IBM
Not sure what you are looking for?
View All ProjectsRegression Models
Regression models include popular algorithms like linear regression vs logistic regression, etc. Depending on the nature of the time series data, we assume an equation for the trend and use methods like least-squares fitting to estimate the coefficients in the equation. The variables in the equation are determined logically. For example, using economics theory, one can assume that the demand for an automobile depends on the vehicle prices, marketing budget, consumer income, interest rates on loans, and a few more variables like that. Such regression models are not that popular as the errors increase as we use them for estimating values in the far future.
ARMA: Autoregressive and Moving Average Model
If you look at time series data closely, you will find such data can be considered a superposition of a component that reflects seasonality and a constant term. While estimating the constant term is not that difficult, the seasonality is usually random and requires attention. For simplicity, we assume that this random component is mathematically stationary, and if that is not the case, we will use mathematical operations to make it stationary in the other space. After satisfying this assumption, one can use the ARMA model which combines an autoregressive process and a moving average process. Let us discuss them in detail.
Get FREE Access to Machine Learning Example Codes for Data Cleaning, Data Munging, and Data Visualization
An Autoregressive (AR) Process
Let Et denote the variable of interest. If we use the following equation to represent the value of Et
(Et -êžµ ) = ᵞ1(Et-1 -êžµ) +μt
Where êžµ: mean of E, μt: uncorrelated random error term with zero mean and constant variance 𜎠then we say that Et obeys a first-order autoregressive stochastic process.
If you look closely at the equation, you can easily decode that the model suggests the value of a variable at time t can be estimated as a proportion of the deviation of the variable’s value at a previous time (t-1) in addition to the random term (μt); with the value, Et still revolving around the mean value delta.
An nth-order autoregressive model, AR(n), is a model that assumes the value Et to depend on previous n values of E, from Et-1, Et-2,..., Et-n. The equation is then given by
(Et -êžµ ) = ᵞ1(Et-1 -êžµ) + ᵞ2(Et-2 -êžµ) + ᵞ3(Et-3 -êžµ)+ … + ᵞn(Et-n -êžµ) + μt
A Moving Average (MA) Process
Let Et denote the variable of interest. Suppose we are using the following equation to represent the value of Et
Et = u + âº0μt + âº1μt-1
where u represents a constant, and μ is the white noise error term. Here the value for Et depends on the weighted sum of the errors in the past and present along with a constant term. If the parameter Et depends on the moving average of p terms in the past. In that case, the model is termed as a pth-order moving average model, and the expression is given by
Et = u + âº0μt + âº2μt-2 + âº3μt-3 + ….+ âºpμt-p
The combination of both the AR and MA models is the ARMA model. The equation for the ARMA model that contains n autoregressive and p moving average terms is given by
(Et -êžµ ) = ᵞ1(Et-1 -êžµ) + ᵞ2(Et-2 -êžµ) + ᵞ3(Et-3 -êžµ)+ … + ᵞn(Et-n -êžµ) + μt + u + âº0μt + âº2μt-2 + âº3μt-3 + ….+ âºpμt-p
ARIMA model for Time Series and Forecasting
The ARIMA model is similar to the ARMA model with the only difference being that the time series is not stationary in this case. Assuming that the time series can be converted into a stationary time series by differencing it d times, we implement the ARMA(n,p) model on the resulting stationary time series. And we then say that the original time series follows the Autoregressive Integrated Moving Average model and denote it as ARIMA(n,d,p). Here are a few special cases of the ARIMA model.
Table: Special Cases of ARIMA model
|
n |
d |
p |
ARIMA(n,d,p) |
Case |
|
0 |
0 |
0 |
ARIMA(0,0,0) |
White Noise Model |
|
0 |
1 |
0 |
ARIMA(0,1,0) + constant |
Random Walk Model |
|
0 |
1 |
0 |
ARIMA(0,1,0) + no constant |
Random Walk with Drift Model |
|
n |
0 |
0 |
ARIMA(n,0,0) |
Autoregressive Process of nth-order |
|
0 |
0 |
p |
ARIMA(0,0,p) |
Moving Average Process of pth-order |
Multivariate Time Series Data Forecasting
So far, the models that we discussed were suitable for univariate time series data, that is, data that involves the prediction of only one variable as a function of time. In practical scenarios, this may not always be the case. We, therefore, will briefly discuss multivariate time series analysis and forecasting models. These models suggest incorporating the cases where the value of a variable at a given time t depends on the value of another variable at a different time in the past. To study these dependencies, we evaluate covariances and correlations using matrix algebra. If the value of covariances and correlations suggests that the variables can be treated independently, we treat the data as a linear superposition of univariate time series. Otherwise, we use complex models such as Vector Autoregressive (VAR) model.
Explore More Data Science and Machine Learning Projects for Practice. Fast-Track Your Career Transition with ProjectPro
Machine learning and Deep Learning Based Models for Time Series Forecasting
With the invention of artificial intelligence, many machine learning and deep learning algorithms have been developed to solve data-related problems efficiently. These algorithms continue to broaden their range of applications, and time series forecasting has not remained untouched by them either. Various data scientists use Greykite, Neural Prophet, LSTM-RNN, etc., to solve time series analysis problems.
When to use Time Series Forecasting models?
After exploring the various time series models for forecasting, let us ponder a few practical examples of these models.
-
Forecasting Sales of a business: One can use time series models to estimate a company's sales and even demands. The models should be chosen to consider seasonality and trends over the years.
-
Predicting the Winning Team of a Game: One may use the random walk model to predict the game's outcome, assigning +1 if the team wins and -1 if the team loses.
-
Population Estimation: Many countries track their population every ten years. You can use that data to predict the population after ten years.
-
Numerical Simulations: Many natural phenomena are interesting time-dependent events that can be simulated using time series models. For example, the Brownian motion in physics can be well represented using the random walk model.
-
Hypothesis Testing: Global Warming refers to the apparent rise in the temperature of the Earth because of the entrapment of greenhouse gases by the Earth’s atmosphere. Many people believe that global warming is a hoax. So, how can data analysis tools help us? Once can use time series models for forecasting the global temperature assuming global warming in a real phenomenon and test if the predictions are correct or not.
We can discuss many more use cases, but what’s the fun if we don’t present a detailed solution, right? So, let us move on to the next section that discusses different projects to help you understand how to pick the best model for time series forecasting for a given dataset.
Time Series Analysis and Forecasting Project Ideas for Practice
Here are practical time series forecasting examples that will help you deeply understand the real-world usage of time series forecasting models.
Time Series Project to Build a Multiple Linear Regression Model
Here is a beginner-friendly project to learn what is a time series forecasting model from scratch. It will introduce you to the basics of time series and shine a light on various tools used for Exploratory Data Analysis. You will learn how to preprocess the data and plot various graphs using libraries in Python. The project will teach you the implementation of multi-regression and symbolic regression models. Furthermore, you will learn the difference between regression and autoregression.
Time Series Analysis Project in R on Stock Market forecasting
Time series methods are used by stock market traders to predict the stock prices of a specific company by analyzing their previous records. This project is a fun time series analysis project to understand the application of various time series models in the R programming language. It will discuss the SARIMA, ARIMA, ETS, Hot Exponential Smoothing, VAR, and neural network-based time series models. Using various statistical tools, you will learn to conclude trend, seasonality, and random terms for a given dataset.
Time Series Project to Build an Autoregressive Model in Python
In this project, you will learn to implement an autoregressive model in Python on time series data. The project will guide you about statistical tools used for exploratory data analysis and white noise testing. You will learn about Q-Q plots, ACF plots, PACF plots, seasonality plots, stationarity tests, and log-likelihood tests. Additionally, the project will help you understand the random walk model and the autoregression model. You will also get to learn about rolling window calculation and expanding window calculation.
Time Series Forecasting Project-Building ARIMA Model in Python
This project is a good starting point for understanding the practical implementation of the ARIMA model. After a brief introduction to the time series, the project will guide you through white noise detection and random walk analysis. Next, it will teach you to use stationary tests and draw seasonality plots and ACF plots using Python. Additionally, the project will discuss the application of the Holt Winter Exponential Smoothing model, ARIMA model, ARIMAX model, and SARIMAX model.
Time Series Python Project using Greykite and Neural Prophet
Greykite is a library in Python that supports Exploratory Data Analysis. Neural Prophet is another library in Python that has various neural network-based time-series forecasting models. This project will use both libraries for predicting the sales of Walmart stores. This project will help you learn about Trend Analysis, Seasonality Analysis, Lagged regressors, and Future Regressors.
Demand Prediction of Driver Availability using Multistep Time Series Analysis
Predicting drivers availability is another exciting time-series application. But unlike the projects mentioned above, this project is slightly different as it first transforms a time series problem into a supervised learning problem. Apart from the primary data preprocessing methods and EDA techniques, the project will discuss the concept of lead-lag, Auto-Correlation Function (ACF) and Partial Auto-Correlation Function (PACF), rolling mean concept, and ensemble models.
LSTM Recurrent Neural Network Python Time Series Forecast
LSTM (Long-Short Term Memory) is a recurrent neural network that is pretty popular among data scientists for time series forecasting. This project will guide you on building deep learning models in Python using the Keras framework. You will learn how to create the dataset matrix to implement the LSTM model and analyze its predictions by creating various plots.
If these projects excite you to explore such industry applications of machine learning and deep learning models and their deployment on a large scale with the help of big data tools, check out ProjectPro’s repository of Data Science and Big Data Projects.
FAQs
Why is time series an effective tool of forecasting?
Time series supports easy analysis of seasonality, trends, and variation in a time-dependent dataset. Additionally, it makes it easy to implement various forecasting models.
How do you do a time series analysis?
Here are the steps you should follow to perform a time series analysis on a given dataset.
-
Plot various graphs to understand the data's trends, peaks, seasonality, and outliers.
-
Deduce whether the data can be made stationary with the help of mathematical tools.
-
Pick a time series forecasting model depending on the type of data you are handling.
-
Transform the series back to its original form by using inverse transformations.
-
Analyze the predictions of the series.

About the Author

Manika
Manika Nagpal is a versatile professional with a strong background in both Physics and Data Science. As a Senior Analyst at ProjectPro, she leverages her expertise in data science and writing to create engaging and insightful blogs that help businesses and individuals stay up-to-date with the