
Building a Visual Search Engine – Part 1: Data Exploration
Ever wonder how Google or Bing finds similar images to your image? The algorithms for generating text based 10 blue-links are very different from finding visually similar or related images. In this article, we will explain one such method to build a visual search engine. We will use the Caltech 101 dataset which contains images of common objects used in daily life.
Why?
Ever wonder how Google or Bing finds similar images to your image. The algorithms for generating text based 10 blue-links are very different from finding visually similar or related images. In this article, we will explain one such method to build a visual search engine. We will use the Caltech 101 dataset which contains images of common objects used in daily life. We will only cover a prototype algorithm and discuss what will be required to develop a full scaled visual search engine.
About dataset
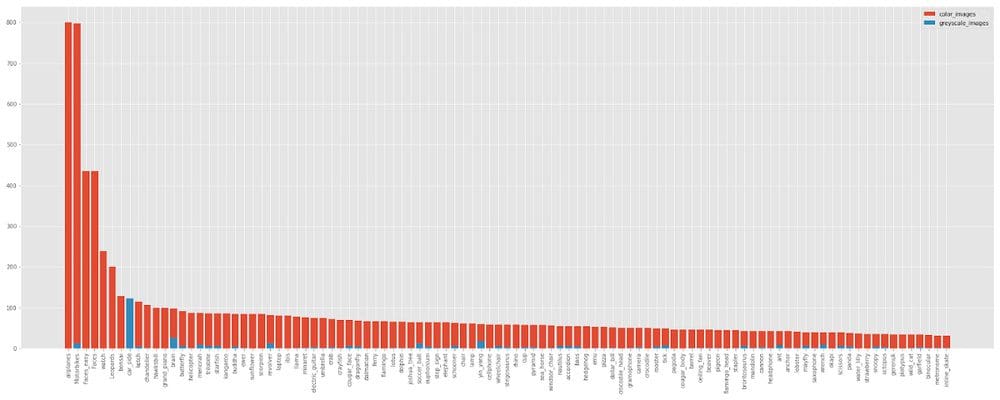
Caltech 101 dataset contains 101 classes of objects like face, tick, knife, mobile, money, etc. It contains 40–200 images per class. In addition to 101 classes, it also contains a background class / noise class to test the model on negative images. The dataset contains 8677 images excluding 486 background images. Below is the frequency distribution of images in classes.
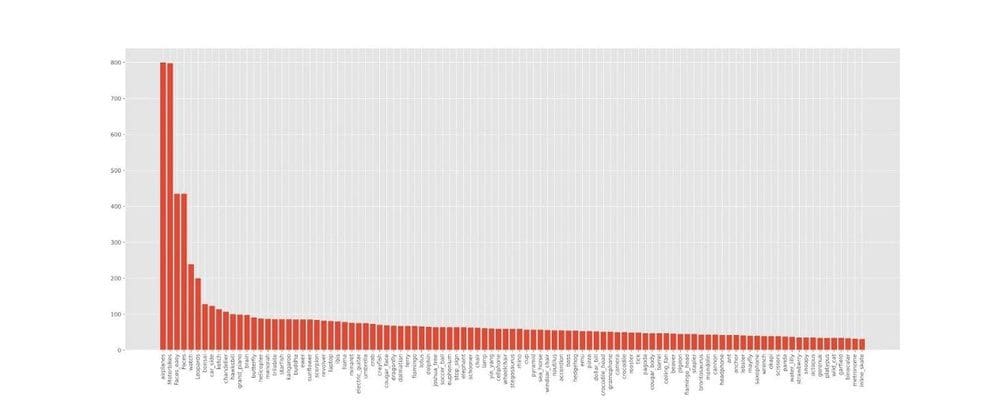
The number of images in each class follows long tail distribution. The most frequent class contains ~16x more images than the least frequent class. Approximately 5% of classes (5 classes) contains ~30% of images. Approximately 90% of classes have less than 100 images.
Note: This imbalance in the dataset can lead to skewed batches when training the model.
Exploratory Data Analysis
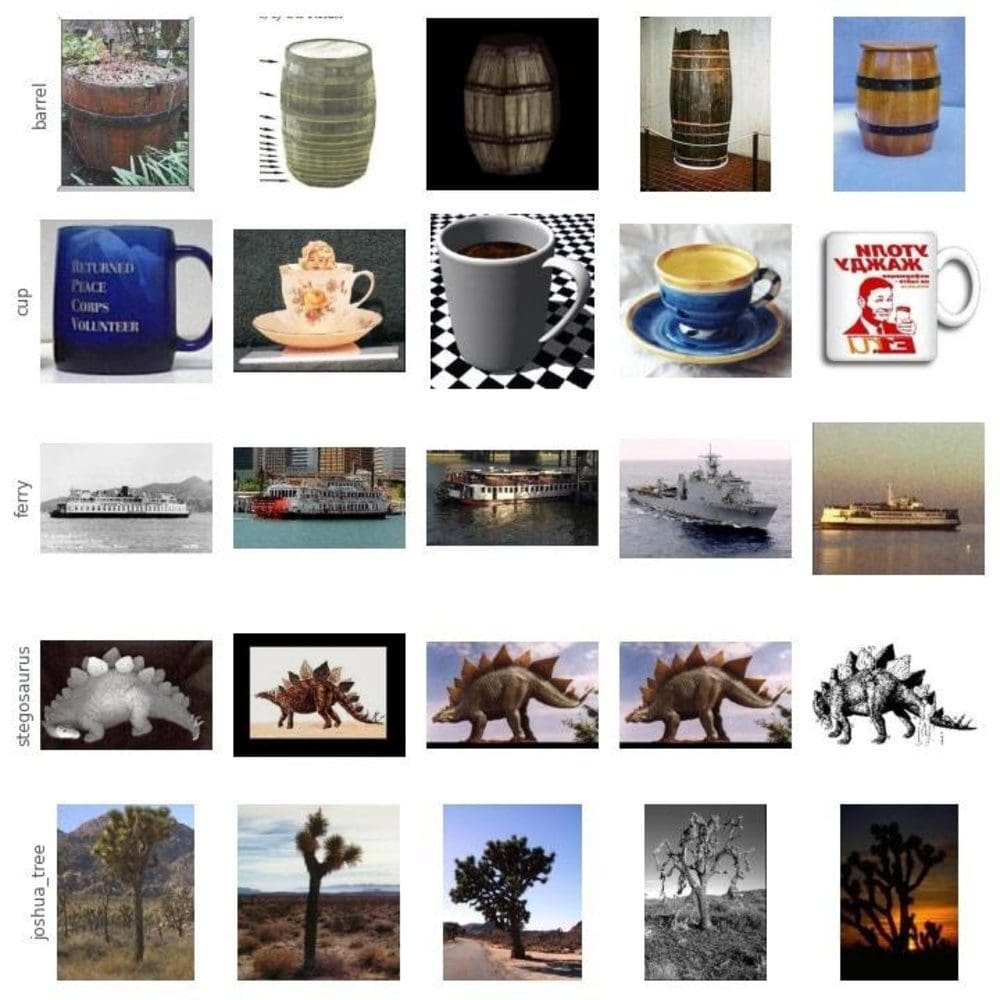
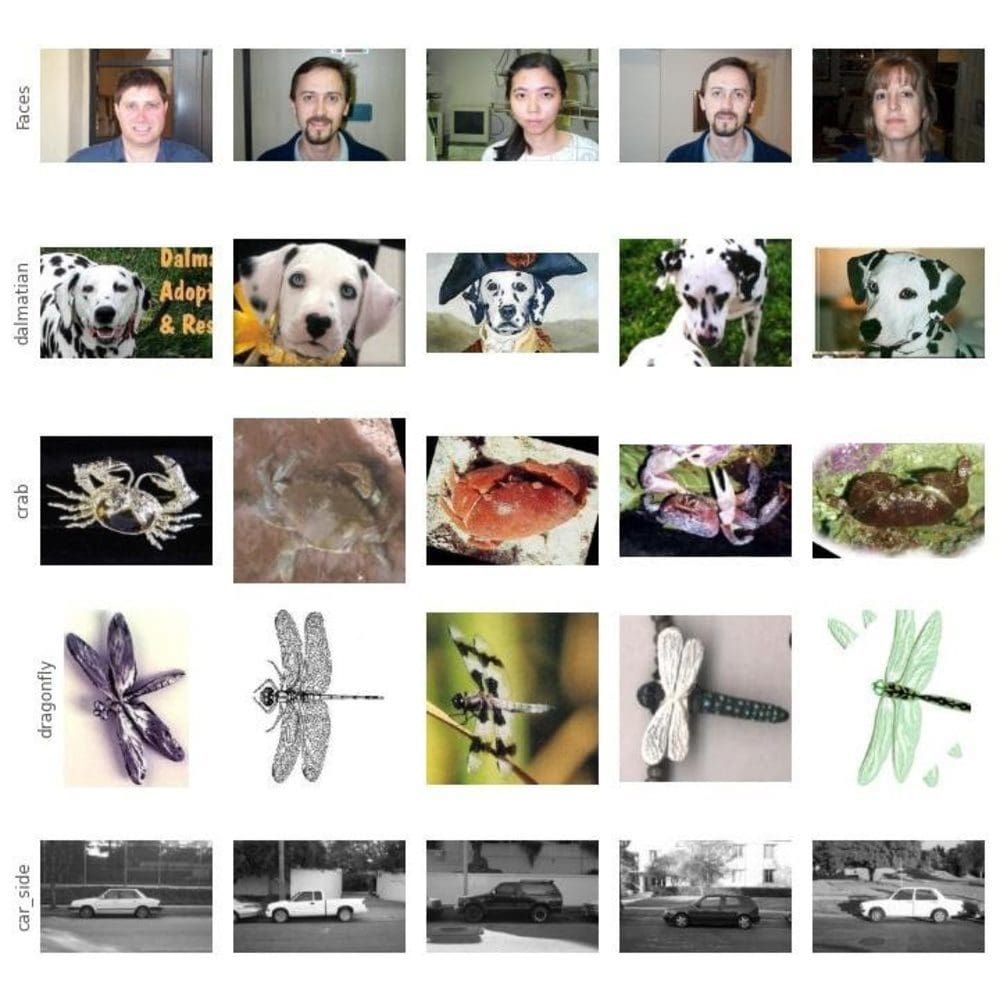
We take random images from randomly selected classes. Please find below some sample images.
Observations
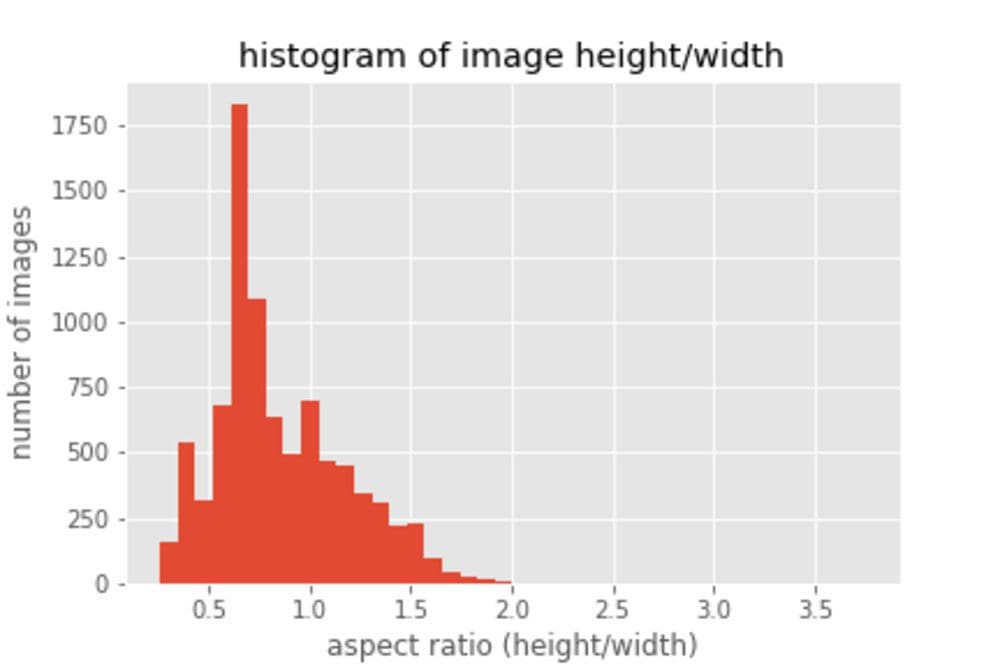
- Aspect Ratio: Images are of different aspect ratio but the maximum side of the image is resized to 300px. Additionally, we try to get the distribution of the aspect ratio to better understand the dataset. We found that most of the images have aspect ratio 0.5–0.8, i.e. the width is larger than height.
- Color vs Grayscale: We noticed that a lot of images in some directory were grayscale images. We implemented a grayscale images check and found that 411 images across 101 classes were greyscale. Next, we checked the class-wise distribution and found that the car-side class had only grayscale images. There are few other classes which contain greyscale images but all of them except the car-side contains color images too.
Data Biases:
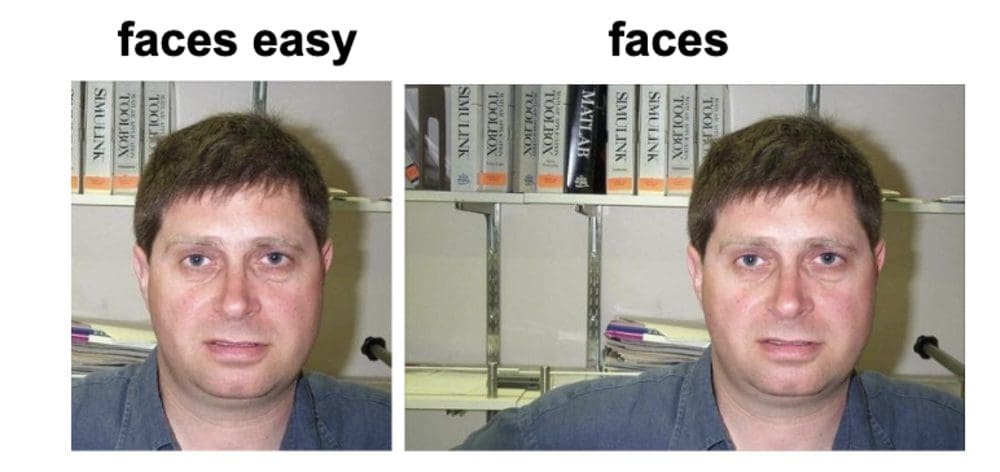
- faces and faces_easy: These classes contain images of faces and cropped faces respectively. But there are multiple images of the same person with slight perspective change. Additionally, the images are very similar in terms of occlusion, background and lighting.
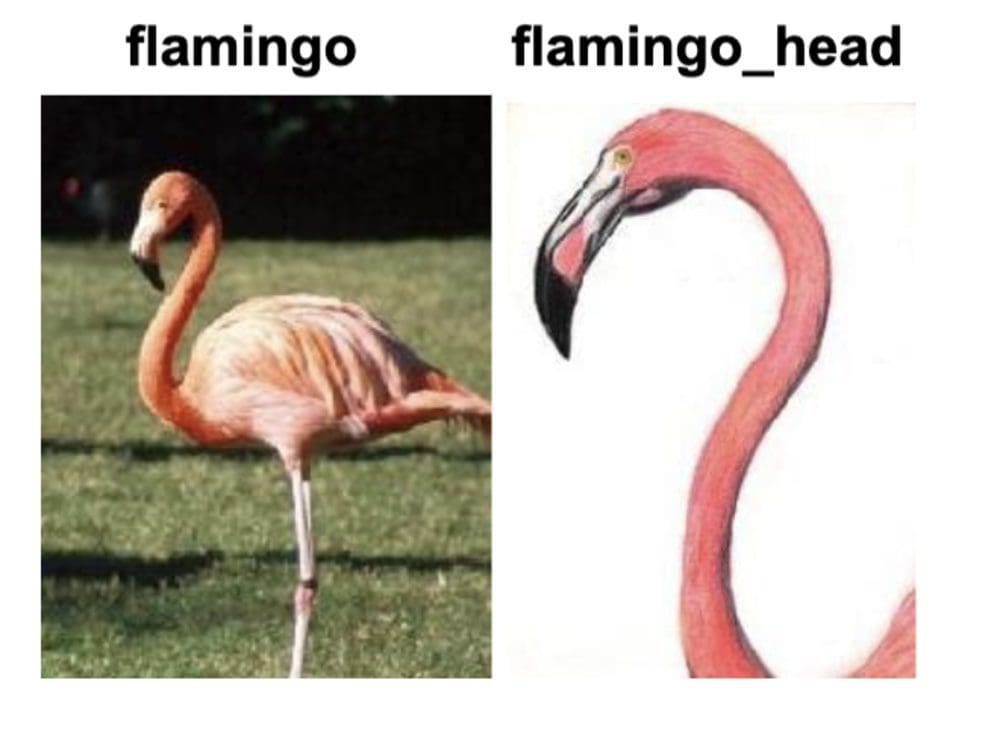
- flamingo and flamingo_head: One class contains the whole body of flamingo and the other contains just the head part of it.
- similar case: chair and windsor_chair
- accordion — images are rotated 45 degrees with black padding
Animated images: A lot of classes contain cartoon images. Cartoon images are semantically right but have different textures compared to real-life images.
Object Location and Scale: We found out that the dataset is biased towards certain scale and location in the image. Object in focus is always in the center of the image and has a similar scale. Objects in the center might not be any problem because CNN models are translation invariant (when used with max pooling or average pooling). But training the model with fixed scale may cause the model to work on similar scale objects only. This will cause the model to fail on images with different scales, which generally occurs in real-life. We propose two solutions to this problem:
- Two Stage Pipeline: We can create a two stage pipeline, the first component predicts the bounding box of the object in focus and the second component predicts what the object is.
- Resizing Objects using Data Augmentation: We can apply data augmentation techniques to rescale the object in focus and train the model on that augmented dataset. This may require the model size to be increased, as it will now store more information (object recognition as multiple scales, because CNNs are not scale invariant)
Occlusion and Background: Majority of images in the dataset have a clean background and the object in focus is not occluded.
Image Rasterisation: Some classes have images that seem to be resized from smaller dimensions. Because of this images looks very rasterised
Embeddings Visualisation
In this section, we visualise images using the embeddings generated from pre-trained model. For this purpose, we used the MobileNetV2 model pre-trained on ImageNet with 2.2M parameters. We used the output of the global average pooling layer, which generates embedding of size 1280.
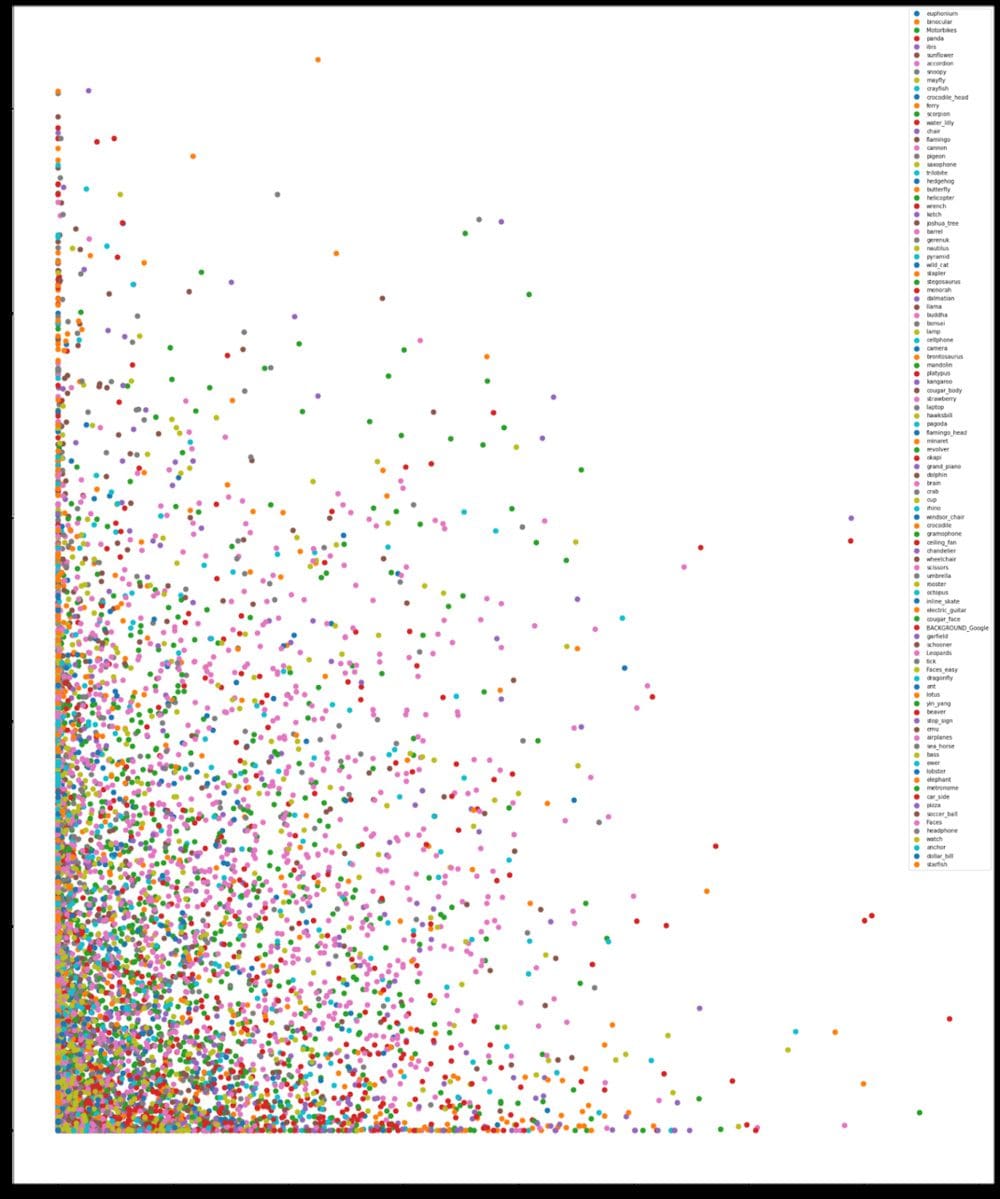
The two dimensional plot of the vector is not very intuitive. This is because the two dimensions combined explains only 8.5% of variance in the data. We also plot these embeddings in three dimensions using TF Projector. The 3D embedding plot explains ~15% of the variance in the data.
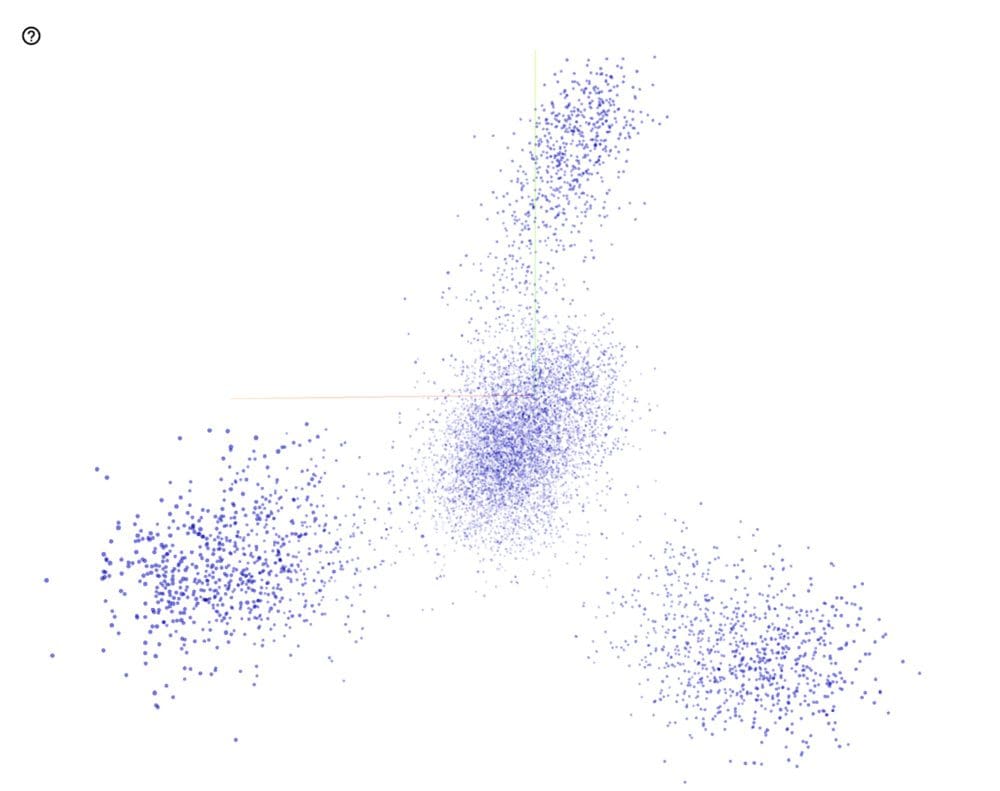
We did not observe any clear cluster of objects from the graph above. But the cosine similarity between images was good representative of the images. For most cases, the images near to a certain image embedding were of the same class. This proves that the model we have used to generate embeddings, focuses on the right aspect of the image and is able to figure out the object of interest in the image.
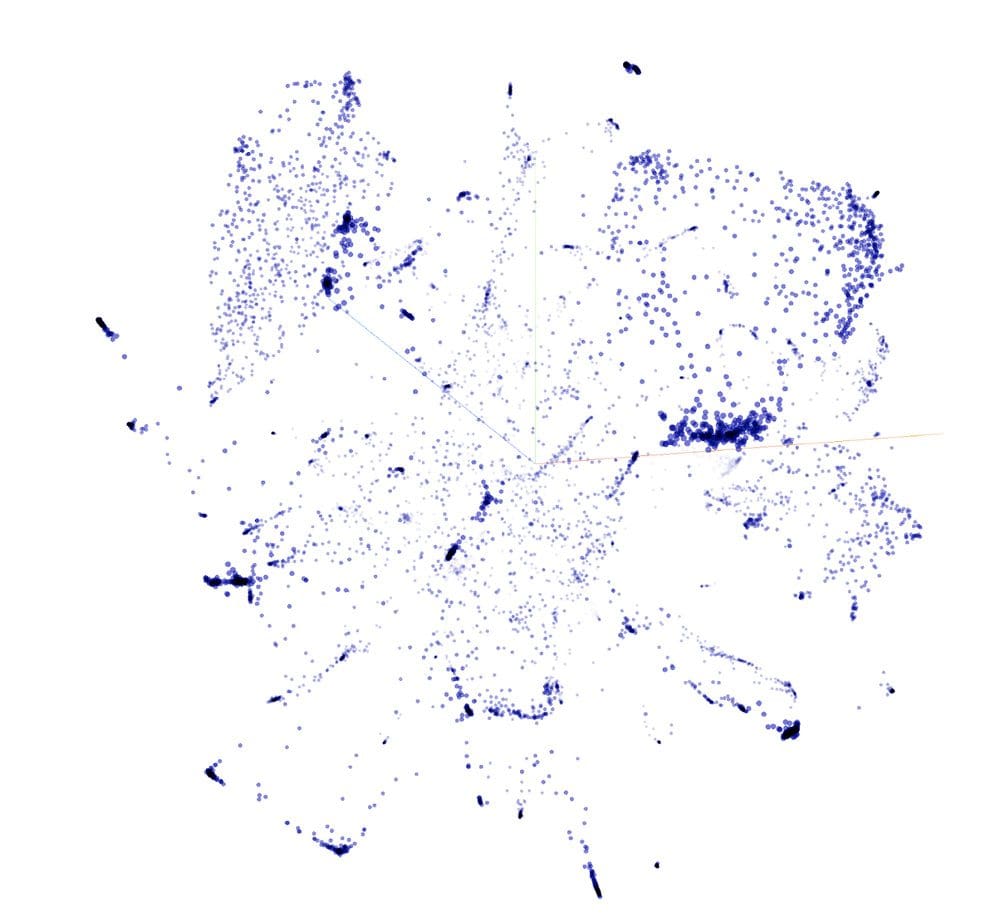
The t-SNE visualisation of the embedding shows a lot of concentrated clusters of classes. Browsing through these visualisations also revealed some similar classes like schooner and ketch, helicopter and airplane, crayfish and lobster, etc.
Editor's note: Join us next week for the exciting conclusion of Building a Visual Search Engine, where we move on from data exploration to cover building the visual search engine itself.
Mudit Bachhawat works as a machine learning engineer at Google, and has more than 5 years of experience in data science, deep learning, computer vision, multi-modal information retrieval, and optimization. Feel free to drop any comments or questions.