

At DoorDash, we use experimentation as one of the robust approaches to validate the incremental return on the marketing investment. However, performing incrementality tests on advertising platforms can be challenging due to various reasons. Nevertheless we strive to creatively apply proven testing approaches to enable scientifically rigorous experimental designs wherever and whenever possible.
One recent example comes in the form of pulling off a lift test of advertising on an app marketplace. In the past, we struggled to determine the impact of our search advertising campaigns on driving downloads of the DoorDash app through that app marketplace. Challenges include lack of control over the marketing intervention (e.g., users in the treatment group will have the opportunity to see the advertising while others in the control group will be intentionally withheld from seeing the advertising) and a lack of precise geo-targeting on the ads platform. Despite these complications, we were able to come up with a viable approach leveraging switchback testing alongside baseline calculations to overcome the limitations of the platform and successfully perform a statistically rigorous incrementality test.
Challenges of experimentation
Digital marketing channels typically have several characteristics that make it hard to conduct scientific experiments. We identified three main roadblocks with regard to the testing on that app marketplace:
- No A/B testing framework
- No capability of supporting precise geo-targeting experiment
- No easy way to conduct user-level randomization, as users have the choice to block the IDFA identifier at the app level
- No robust approach of causal inference using synthetic control
We will discuss each of these roadblocks in detail and address how they impact our capabilities of conducting an incrementality test.
Subscribe for weekly updates
No A/B testing framework
The publisher we used only allows advertisers to measure the lift of different ads creatives. This new testing capability doesn’t enable us to run experiments to understand the true incremental value of ads on business performance. Traditionally, an effective incrementality test starts with the random selection of a treatment group and a control group, where the treatment group receives an ad and the control group does not. Unfortunately, our publisher doesn’t have infrastructure in place to support randomized A/B testing of this nature.
No capability of supporting a geo-targeting experiment
An alternative approach to user-level A/B testing is running a geo-targeted experiment. Geo experiments are a quasi-experimental methodology in which non-overlapping geographic regions (geos) are randomly assigned to a control or treatment group, with ads being served only to geos of the treatment group. Correct execution of the geo experiment would require the ad platform to target ads to the relevant level of location (city, DMA, state, etc.) and link to conversions at a geo-level. However, users can turn off location-based ads per ads preference policy and thus precise geo targeting is not guaranteed.
No easy way to conduct user-level randomization
With the changes of advertising dynamics such as restrictions on user data collection, users have more control over whether or not to be targeted for advertising, and thus we cannot assign truly randomized control or treatment groups. Additionally, user-level data sharing between the advertiser and publisher becomes more stringent as the industry values the protection of sensitive PII Data (personally identifiable information).
No robust approach of causal inference using synthetic control
Another commonly-used approach is to use the synthetic control methodology to conduct causal inference study. The idea is to find a synthetic control group and use a time series of the outcome prior to the marketing intervention from control to predict the outcome during the marketing intervention (counterfactual) and then measure the lift between the counterfactual and actual. Since we will measure the app download, in this case, we can try to build a relationship between Android and iOS two platforms. However, given the fact that our campaigns across different marketing channels are optimized on a regular basis, the distribution of Android versus iOS is constantly changing. As a result, there is no easy way to build a robust synthetic control model to conduct such causal inference study.
How we were able to design an incrementality test
To circumvent these obstacles, we developed an adapted switchback experiment, which can provide insights into the true return on investment of this publisher. The prerequisite of this approach is that you need to measure a conversion that happens right after the ad click, say app installation. If the conversion you want to measure has a time lag after the ad click, then the conversion lift needs to be measured via a scalar factor. For example, the success metric we want to measure is new user acquisition. However, we are not able to directly measure new users acquired because the lag between ads clicks and first orders could be days apart. Hence we first calculate our intermediate metric: app downloads for new users. Next, we determine the conversion rate of new users (download to first order). Lastly, we multiply the app downloads and conversion rate to determine incremental new user acquisitions.
Below is the process we developed to implement this experiment:
- Identify the campaigns of interest which target new users
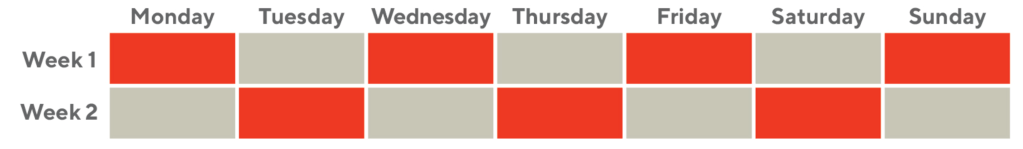
- Randomize the variant (campaign on or off) for each day in week 1 and reverse the sequence of variants in week 2, so on and so forth until the campaign ends. With this approach, each time unit is a randomized experimental unit.
- Collect the metric of app downloads on each day during the test duration
- Aggregate the metric by group (campaign on or off) In Figure 1, assuming the test would run for two weeks, orange and gray cells denote two groups of the test, with orange cells representing campaigns turned off and gray cells representing campaigns turned on. App downloads are aggregated in a new week as shown in each color.
- Define the incremental metric by measuring the difference between two groups.
- Combined with conversion rate, calculate the incremental new customers. This is based on two assumptions that ads don’t directly drive incremental conversion rate and historical data suggests conversion rate is relatively stable with low volatility.
Next, we need to determine our level of confidence that the incremental app downloads are driven by ads, rather than random volatility. There is no doubt that variation of the measured metric, app downloads, is always present. Thus, we need to find a baseline of such variation without marketing intervention.
Calculating the baseline
To successfully measure the difference of app downloads, we need to determine whether the statistical power is sufficient to detect the incremental downloads brought by ads. We ran a t-test on the difference of app downloads by looking at historical data, calculating the baseline of the difference of app downloads.
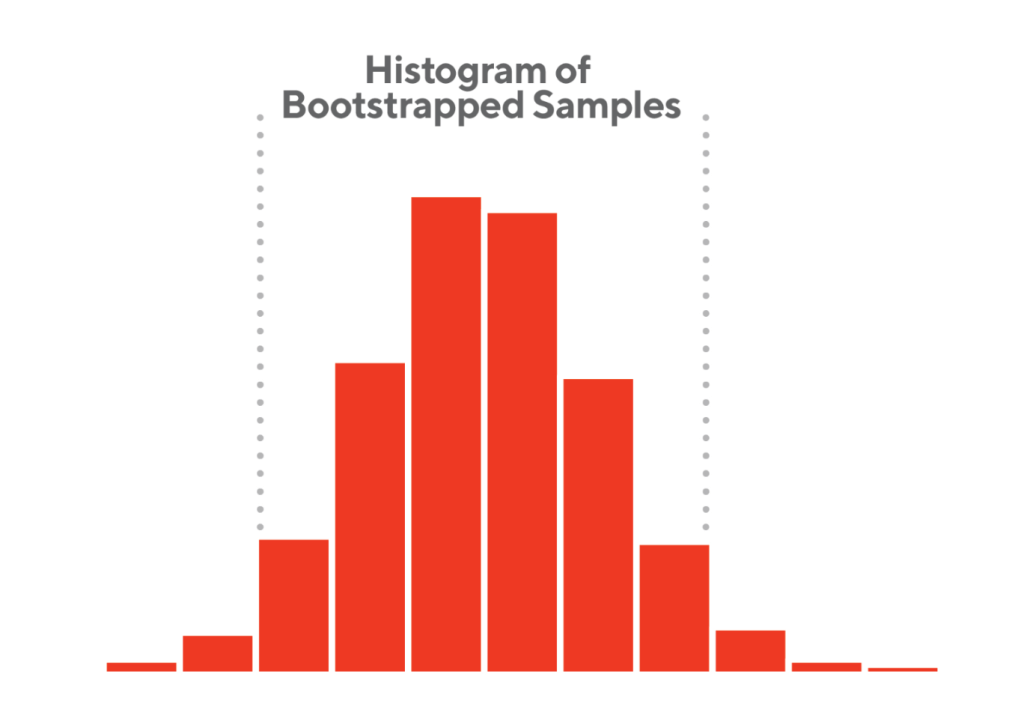
Using weekly data points limits the scale of historical data, particularly after excluding holiday weeks. We chose bootstrapping, which provided more data points using random sampling with replacement. Here are the steps we developed to bootstrap the data to get a suitable baseline:
- Consistent with the test design, create new weeks based on the same pattern of randomization of days
- Calculate the difference between two consecutive new weeks
- Repeat step two for a large number of times
- Calculate each sample mean and based on bootstrapped samples from step three, measure the confidence interval
After the baseline calculation, as shown in Figure 2, we determined the difference of app downloads at a 95% confidence interval, which denotes the variation of app downloads without media intervention.
Consideration for experiment unit randomization
We conducted pre-experiment analyses based on historical data by contemplating the following three randomization methods:

Through the analysis, we reflected on the pros and cons of different randomization methods:
- Simple random sampling is not recommended as this doesn’t consider the day-of-week effect, which creates the imbalanced control and treatment groups.
- Stratified random sampling may reduce the biases, however, we need to sample from a longer time window as illustrated above. The longer test will hurt the business growth goal as we cannot reach the target audience during a longer no-campaign period.
- Alternating time intervals may increase some biases with the benefit of reducing the variances. We also have a balance of weekends assigned to both control and treatment groups. When we analyzed the historical data, by simulating the starting point to either campaign on or off, we didn’t see a significant increase of biases.
With business implications and methodology rigor in mind, we chose the last randomization method for the analysis.
Some checkpoints before conducting the test
Given the unique nature of this test, there are some additional checkpoints we need to consider to determine the feasibility of such a test.
- User behavior when seeing an ad, especially: the time lag between a user seeing the ad and downloading the app. If downloading is not an immediate action after seeing an ad, the current test design won’t be applicable. For example, if a user sees the ad during a “campaign on” period, but downloads it during a “campaign off” period, the treatment and control scenarios will not be successfully isolated.
- The time lag for intervention, e.g. how soon a pause/unpause will take to go into effect. For example, we have observed that it typically takes a couple of hours for ads to disappear after we pause them. To compensate, we plan ahead and incorporate this time window into the test.
- The appropriate definition of the conversion window. We pre-define a conversion window aiming to capture the majority of the conversions.
Before we formally conclude the design of this test, we need to consider the limitations of what this test can measure.
Limitations of the incrementality test
- The test design is prone to unforeseeable disruptive events during the test period. If there is a system outage, e.g. the app marketplace is down, this could impact the results.
- The baseline requires relative consistency. In other words, the trend of the historical baseline should persist through the test period. This is also part of the reason which motivates us to take into consideration business knowledge such as known seasonality for randomization, so that we can observe the consistent trend of baseline and test periods.
- Bidding pressure from competitors. For example, competitors might react to the bidding dynamics during the test period and change their bidding strategy which would bring external impact on users’ actions to our ads.
Conclusion
For data-driven companies like DoorDash, we lean on the learnings of incremental benefits generated by marketing investments from such incrementality tests, which will guide the DoorDash marketing team on where best to spend its advertising dollars. Previously, we were unable to tell if and to what degree such ads on the app marketplace are driving incremental new customer acquisition due to lack of experimentation infrastructure on the publisher’s platform. The proposed switch-back technique provides a reasonable testing alternative. Suggested applications are outlined below:
- Coupled with incrementality tests for other channels, such lift insights will be used to inform calibration of Marketing Mix Models as well as future budget allocation across various paid channels.
- In conjunction with other attribution methods (e.g last-click, multi-touch, linear), we can calculate the so-called incrementality scalar, ie., the ratio between experimentation-based incrementality and attribution. This can provide marketers a heuristic rule for right-sizing the magnitude of existing attribution results.
This approach can be applicable to other use cases as well. For example, for other advertising platforms that don’t have the experimentation infrastructure to support the classic A/B testing, we can consider such adapted switch-back experiment in which we assign different time windows instead of individual users to treatment versus control when conditions below are met:
- Success metric can be measured directly within a reasonable lag of intent to action
- Similar trend between historical baseline and test period
- Robust randomization of experiment units
Acknowledgments
Thanks to all members of the cross-functional team for the support to review this post and provide constructive feedback, Jessica Lachs, Gunnard Johnson, Athena Dai, David Kastelman, Sylesh Volla, Ruyi Ding, Ariel Jiang, Juan Orduz and Ezra Berger.


Very interesting article “Adapted Switch-back Testing to Quantify Incrementality for App Marketplace Search Ads”. I come from the older direct marketing formats, so learning about the issues of newer streams is useful.