This is my second article on “Why do you find Data so interesting after all these years ?” and my anwser is always “it is not about the subject, it is about the people”.
A distinctive and instantly-recognizable style
I was reading this article “Is the Tableau Era Coming to an End?” with no author and long before the conclusion I was telling to myself “looks like an article from Taylor Brownlow”
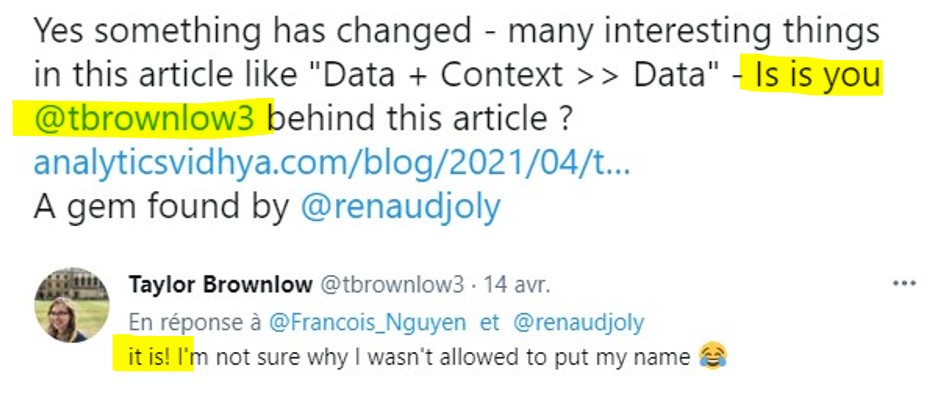
It is clearly not easy with so many authors on the Data topic to have a distinctive and instantly recognizable style but Taylor Brownlow has really different ideas and she has clearly an outside-the-box mindset. IMHO, she is far ahead of current practices and I am sure that some of her ideas will become standards in the future. So let’s discover her work and her convictions.
Dashboards are dead
In this article (episode 1), she is not the first person to say that dashboards are dead. The interesting part is that it is based on her experience where she has observed :
- The time and ressources spend to build these dashboards
- The flexibility is based on filters and it is and endless task
- The “not my dashboard” syndrome where you have different versions for every truth
But the solution for her is not to build better Dashboards or get a magic BI tool that will solve your problems but “going to portrait’s mode” with data notebooks. Using this definition from the Jupyter website, a “notebook is an open-source web application that allows you to create and share documents that contain live code, equations, visualizations and narrative text. Uses include: data cleaning and transformation, numerical simulation, statistical modeling, data visualization, machine learning, and much more”. From a 10 000 feet view, it looks like a word document but with a web interface.

- Switching to “document mode” : we are seing this trend more and more (with the Async way of working) but a document is the best way to collaborate. A document can be annotated and you really can have a group of people working together. A data science notebook (as today) will not be enough but when you can see the way people are using Google Docs, it could inspire a total different approach for what I am calling the last mile delivery in Data. You can really have in one place what (with the results), how (the process) and why (comments)
- Using Code to explain the process : the good part with data science and notebooks is the strong emphasis on reproducibility. It helps of course for the traceability and the explainability too. It is not going to be for everyone and it will depend on the level of maturity of the users. But you can see more and more data analyts being able to read and create SQL query. Even if you still have a strong pushback on the business side too : “we are not developers”. This is a question of time and again it is not for everyone.
- Extension : another interesting part is the ability to “extend” the document. You can add new chapters in the document because the business context has changed and you need to focus on some analysis. In a way it is like writing a book where you can add chapters because you have new findings.
It is not just a question of capabilities, it is a radical change from the current BI apps by switching from >>> to.
- App >>> Document
- Parameters >>> Code
- Limited modifications >>> Unlimited extension
and the set of skills needed is very different (structure of written communication, coding, obsessed with auditability). The next question is of course why should you invest in that shift ?
The Analyst’s workflow is broken
In her second article, you are going to discover her sense of humor. She has this schema about the life of an analyst trapped in an infinite loop 😆

She has no less than 8 archetypes showing that how difficult is the life of an Analyst. Every company is investing a lot in collecting the data but the real life is that the last mile is often a set of manual steps to deliver the final product. The problem has many root causes :
- No clear place to collaborate or interact between the different actors (using the email today)
- No single place between the query and the final result
- No single technology (SQL, python, others)
In this article, she is giving the historical perspective (SQL IDE, Excel, Dataviz) and for her it is now the “notebook” era. My feedback on that part is that we have removed none of these tools : we still have all of them today. It is highly probable that the notebook way will become a possibility and you will still keep the old stuff. My hope is that it will replace the SQL IDE and the dataviz part (my hope) – I will be dead long before the end of Excel. But this “notebook era” can bring much more.
Numbers Are No Longer Enough
I love the subtitle of her 3rd article “To make better decisions, we need data tools that communicate more than just numbers”. And she has this wonderful graphic to explain it !
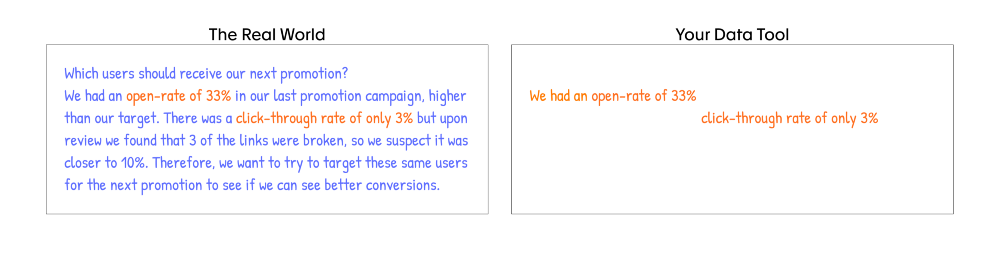
She is brillantly right : context is king. And it is about to be focus on the structure of the written communication versus having a collection of graphics. I see a strong link with the 6 pager Amazon : a solid part of their culture. But I also see a link with the Async move mentioned before (https://www.weareasync.com/) : you have the example of Github where you have more and more collaboration around a structured document.
At the end of the article you have this motto “data + words = impact”. After these 3 articles, hope you are convinced about the benefit of using a data notebook.
Your Organization’s First Notebooks
The next question is how are you going to implement your first notebook ?
Her answer is to focus on “data request the most important process no one likes” (so true). Using a Notebook helps having everything in one place to
- manage it from the data needed to the results or visualizations
- explain the context and the result
- to manage iterations (agile way of working)
In fact, there is an ocean of opportunities in this data notebooks world if the actors can execute. My only concern is that you have to reconciliate the open source world (today with Jupyter Notebooks for example) and the BI world (licensing and souscription). The benefit of the open source world is not just because it is free, you have also the benefits coming from the community. On the other side, in the BI world, you are going to pay and have a roadmap but it will be a bottleneck too because ressources of the software company are not unlimited. Beyond the tool, the future of the business model is also a question. Her article on Tableau is asking the right questions (it is the end of something).
Conclusion
I strongly recommend to spend time to read her 4 articles (it is like a Netflix mini serie). I just tried to highlight what I like most but I am sure you will find many other findings. If you are in a situation where you need to “re-think” the way you are doing data analysis for the business, her work will help you to understand what’s wrong (this article is brillant too about the relationships between the requester and how to anwser to any business question).
I also recommend this video where she is doing a demo (thanks youtube) : she just not has a lot of skills, this is the combination of her skills that is unique. Among these skills, you have writing interesting articles on Data.
