Self-hosted integration runtime in the context of Azure data factory is a gateway that connects the on-prem data sources to datastores in the cloud. To know more about Integration runtimes, please refer to the previous post.
We have discussed how to check whether Integration Runtime is online or offline using PowerShell command in a previous post. In today’s post, lets have a look at how to monitor self-hosted integration runtime metrics such as CPU utilization, Available memory, number of concurrent jobs etc.
We will be using Resource Monitor to view the metrics. To do this, simply navigate to the Data Factory on the Azure Portal and then to Integration Runtime tab under the Monitor icon :
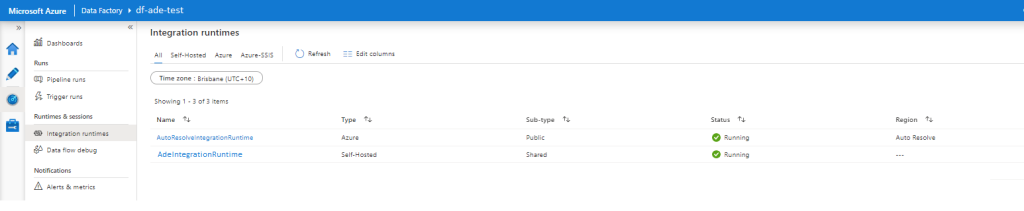
After that click on the self-hosted Integration Runtime name, to view the detailed metrics (In the above screenshot it’s AdeIntegrationRuntime):
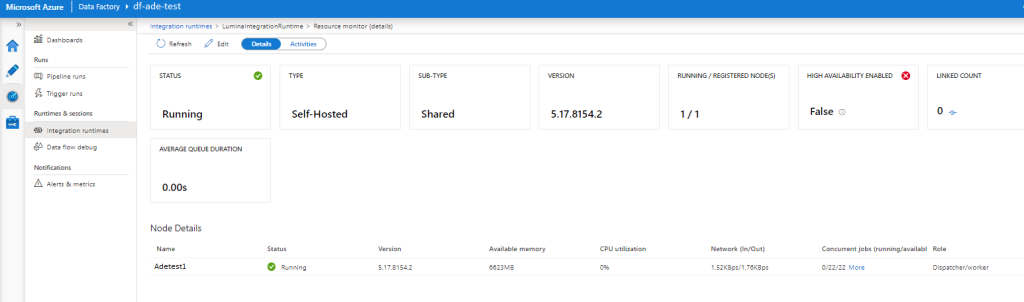
As seen in the screenshot above, the resource monitor screen shows some important metrics such as:
Status: Running or Offline
Running/ Registered nodes: A self-hosted integration runtime can have up to 4 registered nodes.
Queue Length: Number of activities waiting to be processed
Average Queue Duration: Avg. time (in sec) that an activity waits in the queue
Available memory: Amount of available RAM on the available node(s)
CPU Utilization: This is the CPU utilization percentage of the machine where self-hosted Integration Runtime has been installed.
Network (In/Out): Incoming (On-prem to Integration Runtime) and Outgoing (Integration Runtime to Cloud) bandwidth.
Concurrent jobs: Number of concurrent jobs running on the self-hosted integration runtime
