


At DoorDash, we generate supply and demand forecasts to proactively plan operations such as acquiring the right number of Dashers (delivery drivers) and adding extra pay when we anticipate low supply. It is challenging to generate accurate forecasts during holidays because certain machine learning techniques (e.g., XGBoost, Gradient Boosting, Random Forest) have difficulty handling high variation with limited data. Here we explain how we improve forecasting accuracy as we prepare for holidays with an eye toward ensuring high-quality experiences for both customers and Dashers across thousands of markets.
It is imperative that we take supply and demand shaping actions to reach an equilibrium that ensures quality for both customers and Dashers. Supply and demand forecasts are main inputs for our proactive mobilization systems, as shown in Figure 1 below. We use a gradient boosting machine (GBM) model to generate our forecasts across thousands of starting points — small groups of ZIP codes. For reasons we will delve into later, forecast accuracy dips around rare extreme events such as holidays. . To improve accuracy around these events, we adopted a cascade modeling approach which extends the GBM with a linear model to handle the holiday’s impact. This model architecture dramatically improves forecast accuracy on holidays.
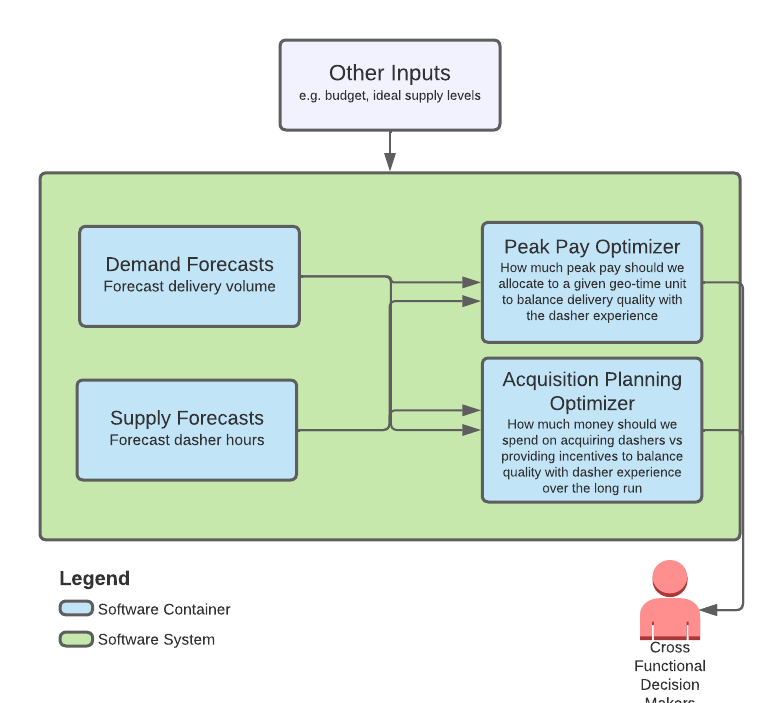 |
| Figure 1: Demand and Supply Forecasts Support Various Components of DoorDash Proactive Mobilization Systems |
Limitations in Random Forest and Gradient Boosting Methods
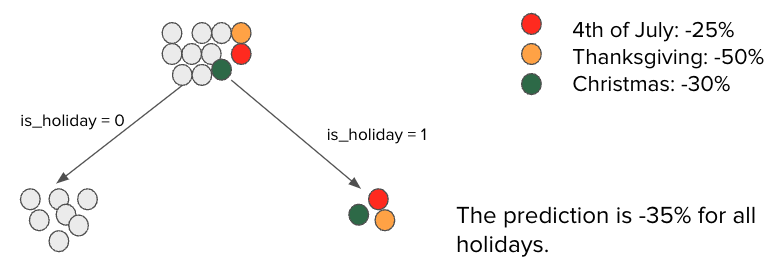
Tree-based models such as random forest and gradient boosting are popular in industry for their ease of use and high accuracy. For time-series forecasting in particular, these models capture excellent seasonality with appropriate feature encoding, handling non-linearities and, most importantly, avoiding overfitting. These strengths, however, make it challenging to handle anomalies and high variation. In particular, tree-based models fail to capture high variation during holidays even with one-hot encoding because each holiday only appears once a year. Please see a simplified example of this in Figure 2 below.
The figure shows how a tree assigns different root node observations to its final nodes, or leaves, when trying to minimize the loss function and avoid overfitting. Assume that our dataset contains holiday observations, represented by colored dots, where order volume decreases in large amounts — for instance, a 50% decline on Thanksgiving Day when compared to regular days, shown as gray dots. When we train the model to minimize the loss function and avoid overfitting simultaneously, the extreme observations will end up under the same final node. In this scenario, the prediction for a holiday will be a simple average of all holidays in the final node (i.e., -35%), which generates a significant error of -10% for the Fourth of July holiday and +15% for Thanksgiving. In other words, we over-forecast for the Fourth of July and Christmas, while under-forecasting for Thanksgiving.
 |
| Figure 2: Tree-Based Model Cannot Generate Accurate Forecasts for Holidays |
Overview of the Cascade Modeling Approach
Over the years, machine learning practitioners have developed architectures and design patterns, including reframing, rebalancing, and multilabel ensembles to address the limitations of ML models. A common approach is to deploy a cascade design pattern when the underlying ML problem can be divided into sub-ML problems (as seen in the book Machine Learning Design Patterns by Valliappa Lakshmanan, Sara Robinson, and Michael Munn). For instance, when dealing with a prediction problem with two different subgroups, an ML practitioner could build two models for premium versus regular customers instead of a single model for all customers. We expect the two-model solution to perform better because each model is tailored for its respective subgroup.
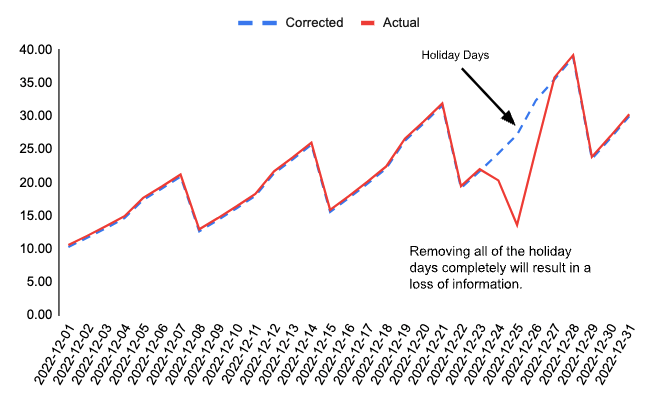
In our case, this approach could mean building two separate models — one for holidays and another for regular days. This solution, however, does not fit our framework because our problem is time-series forecasting, which is highly dependent on the most recent historical observations, as seen in Figure 3. In other words, if we have two separate models then the model for regular days would fail to generate forecasts for the week after Christmas because it would not have information from the most recent lags. To prevent losing the most recent information, we implemented an augmented version of a cascade design pattern tailored for time-series forecasting. As shown in Figure 3, instead of building two models, we correct the actual series by removing holiday impact so that recent historical information is available when producing forecasts following a holiday.
 |
| Figure 3: Cascade Design for Time-Series Data Aims to Keep Most Recent Observations After Removing Holiday Impact |
Subscribe for weekly updates
Implementing Cascade Approach for Supply and Demand Forecasts
We utilize the GBM model to generate supply and demand forecasts for initial points; however, we experience significant declines in accuracy during holidays. As seen in Figure 4 below, the accuracy of the GBM model, which is measured in terms of weighted mean absolute percentage error (wMAPE), deteriorates around Christmas Day.
 |
| Figure 4: Performance of GBM with Traditional Feature Engineering At/Around Holidays |
To improve accuracy, we implemented the cascade approach in multiple steps.
- Calculating holiday multipliers: We run a linear regression with holiday dummies for each starting point-daypart pair in our data and calculate the holiday multipliers as the coefficients for the holiday dummies. For instance, we could have a multiplier of 1.5 for Thanksgiving Day in Springfield, Ill., implying that the order volume will decrease 50% week-over-week for that starting point at the given holiday-daypart pair. We have to fit thousands of linear regressions when calculating the holiday multiplier for each starting point-daypart pair. To improve the speed and reusability, we constructed a separate framework for this step. In this framework, we leverage parallel computation in Spark and store the holiday multipliers into a table for the GBM model to use in the preprocessing step.
- Preprocessing holiday multipliers and model training: We preprocess the input series — for example, number of orders — by the holiday multipliers to turn it into “holiday-free” figures, which is similar to converting actual to corrected values in Figure 3 above. For example, if the number of orders on Thanksgiving Day in Springfield was 100 in 2022, the order number becomes 150, given that the multiplier is 1.5. After preprocessing to obtain the non-holiday figures, we train and store the GBM model.
- Generating forecasts and post-processing: First we generate forecasts for future dates using the trained GBM model. Because the GBM model was trained with non-holiday data, our initial forecasts do not take holidays into account. To obtain the final holiday forecast, we use the holiday multipliers that were calculated in Step 1 for post-processing. For example, if the non-holiday forecast for Thanksgiving Day is 150 and the associated multiplier is 1.5 for a given starting point, the final forecast is 100 (=150/1.5).
 |
| Figure 5: We implement the cascade model in multiple steps: [1] calculating multipliers, [2] pre-processing and training, and [3] generating forecasts and post-processing. |
Mobilization System
DoorDash’s mobilization system shown in Figure 1 is a collaborative effort between operations, finance, engineering, and machine learning teams. As DoorDash grows, we wish to produce scalable ML and AI solutions that require minimal manual interventions by operations and finance teams. However, performance degradation of holiday forecasts forces us to make ad-hoc changes to the ML pipeline, consuming extra computation resources and overhead for operations and ML teams. To run flawlessly, our mobilization system needs reliable forecasts for all days of the year, including holidays. In this respect, cascade design removes another block on the roadmap to a fully automated mobilization system.
Holiday Impact Estimator in Action
DoorDash generally follows two steps before pushing a new feature or model into production:
- We size the opportunity and if the movement in metrics is strong enough, we launch an experiment to ensure that the positives outweigh the negatives.
- The final decision is made after analyzing experimental results; stakeholders across multiple teams must agree that the new feature adds value without degrading business metrics.
In the following section, we will go over model performance improvements, how we sized the holiday impact estimator’s impact on our production systems, problems we encountered with the experiment measuring that impact, and how we eventually overcame the challenges and got stakeholder buy-in.
Measuring Model Performance
The cascade approach to modeling holiday impact proves to be a significant improvement over a simple feature engineering approach. As shown in Figure 6, wMAPE decreased from between 60% and 70% to between 10% and 20% over Christmas. Thanksgiving had a similar impact. Averaged across an entire year’s worth of holidays, we see an absolute wMAPE improvement of 10%.
The cascade model had also better performance in the days following a holiday compared to GBMs with simple feature engineering because the simple GBM carries extreme changes during holidays over into the following weeks. The cascade model generates predictions from a GBM model trained on holiday-free data without any extreme movements (see Step 2 of Figure 5 above).
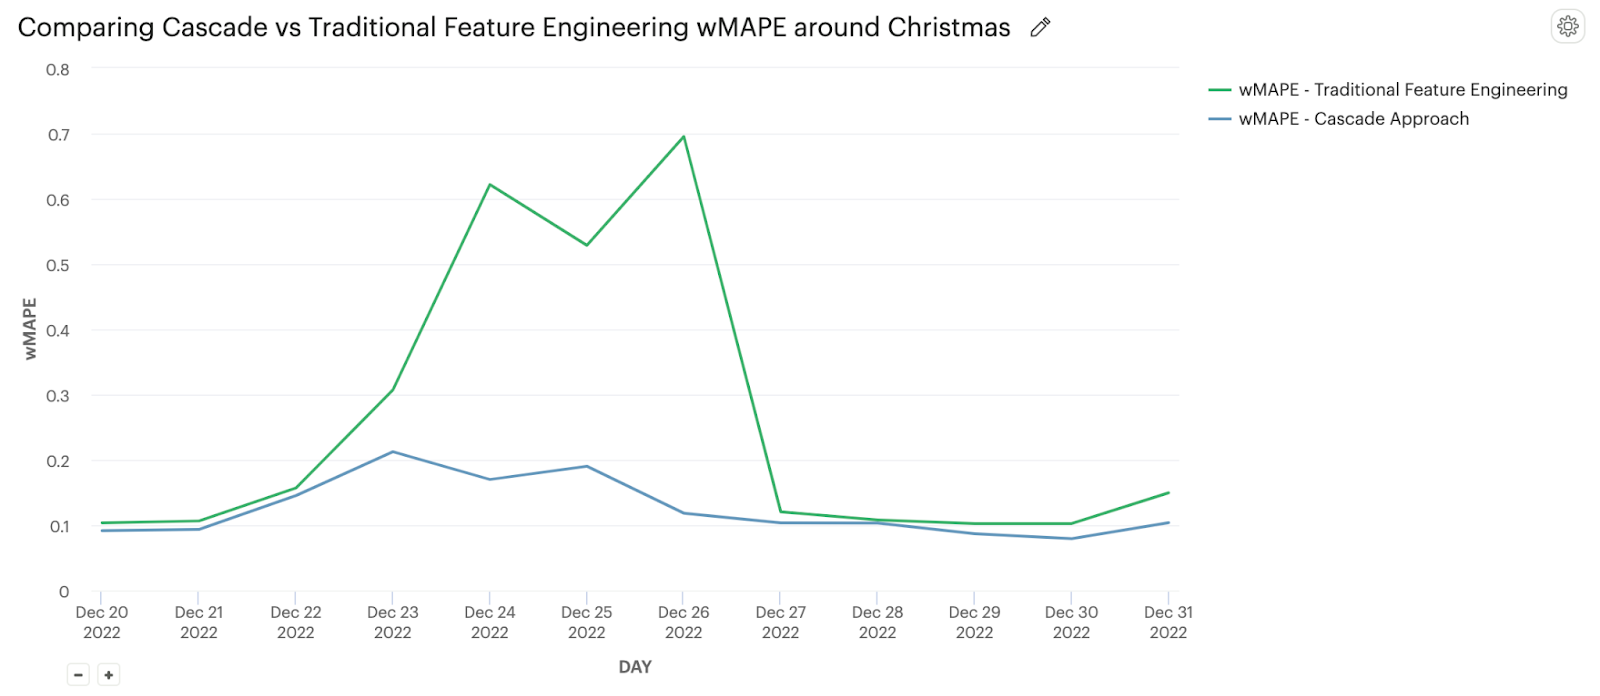 |
| Figure 6: Cascade Approach Decreases wMAPE compared to GBM with Traditional Feature Engineering |
Measuring Business Impact
While a clear improvement in model performance appears to be a straightforward deployment decision without the need for experimentation, there are some important tactical considerations. Inputs can interact with systems in unexpected ways, resulting in contradictory outcomes. Take, for instance, a pay allocation system designed to hedge for situations with high forecast variance i.e. if we are unable to forecast demand well due to high underlying variance, we always add pay to account for forecast misses. Improving forecast accuracy would mean reducing forecast variance, which in turn could lead to the cessation of hedging (additional pay). Consequently, there's a potential for the customer experience to suffer due to inadequate supply. This underscores the essential need to conduct analysis to effectively evaluate proposed changes and make changes to the system if needed.
Supply and demand forecasts have a direct impact on how much we spend around holidays to keep supply quality strong, as we discussed earlier. We ran backtests for Thanksgiving and Christmas to estimate costs and potential quality impacts. Our backtests showed that we could reduce volume lost from bad quality by ~25% over Thanksgiving and Christmas. Our next step would be to launch an experiment to solidify these estimates further and get stakeholder buy-in for shipping the new model.
The Limitations of an Experiment
The main challenge we encountered when trying to demonstrate value through an experiment was the limitation in experiment power. Most experiments at DoorDash use a switchback experiment design based on geo-time units to maximize power (here is more info on switchbacks). In this case, however, using a switchback was infeasible because of potential interference through network effects. For instance, if our treatment forecasts lead to extra pay added to a certain geography later in the day, Dashers might choose only to Dash later, or if our forecasts added pay to a neighboring starting point, Dashers might migrate there to earn extra cash.
The only feasible design option to remove these network effects would be to launch a market A/B in which one market uses the treatment forecasts while another uses the control. Market A/B design significantly reduces power because of small sample sizes, meaning we have to run such experiments for longer periods of time. Given the intermittent nature of holidays, the nature of this experiment would likely require running it over the course of at least a year to get enough power to measure impact, which is not feasible.
Consequently, we had to reframe our experiment’s goal. Rather than accurately measuring the cascade approach’s impact, we decided to focus on ensuring that it does not worsen quality. If we could keep metrics flat without seeing quality degrade across a set of selected holidays, we could then make the decision to ship.
Getting Stakeholder Buy-In
Getting finance and operation teams buy-in generally is easiest when we’re able to experimentally prove value without quality degradation. But because there are few holidays, reducing our experiment’s power, we had to take a different approach. To make a strong argument, we ran backtests across multiple holidays to get estimated improvements on quality metrics. We also used results from a market A/B experiment run across Super Bowl day, Valentine’s Day and President’s Day to show that there was no system degradation. This helped create a best-case/worst-case scenario comparison, which eased concerns that the new approach might worsen quality and the Dasher experience.
Practical Considerations of the Cascade Approach
While the cascade model performs better during holidays and generates significant accuracy improvements, they come at the expense of extra steps, including adding new models and pipelines such as calculating holiday multipliers and performing both pre- and post-processing. Even though calculating the holiday multipliers seems like an extra step, they helped us to explain the forecasts to our stakeholders, which built more trust in our models and accelerated the transition to end-to-end ML solutions with minimal manual intervention.
ML practitioners should evaluate the pros and cons before deciding to use the cascade design pattern. If the process adds significant complexity to the model architecture with only limited gains in target loss, it may not be worth the effort.
Conclusion
Tree-based models such as random forest and gradient boosting machines are widely used in the ML space for forecasting, prediction, and classification. Although the tree-based models perform well in capturing non-linear relationships, they fail to account for extreme events such as holidays. Deploying cascade design patterns for time-series forecasting during holiday periods at DoorDash has generated significant improvements in forecasting problems. We also discussed the benefits and difficulties inherent to using a pure experimentation approach. While experiments remain the gold standard for measuring impact, we sometimes need to reframe our goals or rely on backtests to make timely ship decisions.
Acknowledgements
Many thanks to Ryan Schork, Gisselle Xie, Michael Frasco, and Tim Burke for sharing their feedback on the execution of ideas in this blog post. Many thanks to Ezra Berger for continuous support, review, and editing on this article.


Hi! Thanks for sharing the excellent tech article about using cascading patterns to improve holiday effects.
I am confused about how to train the LR model. What are the X and Y to let model coefficients be holiday multiplier?
Could you give me an example to figure it out?
Thank you!
Thank you! Very interesting approach.
One detail is not clear. At first step, when you calculate multipliers, running the linear regression, what is the target variable and what are the features except holiday dummies?
Thank you!
Hi Aaron,
Thank you for your question. The y is week-over-week change in number of orders, and X features are holiday fixed effects along with other time based features (e.g., month FE, year FE).
Please let us know if you have any other questions.
Thank you,
Chad
Hi Ekaterina,
The target variable is week-over-week change in number of orders, and the features other than the holiday dummies are month and year fixed effects. You may also add other relevant feautures in your case.
Thank you,
Chad