

Metrics are vital for measuring success in any data-driven company, but ensuring that these metrics are consistently and accurately measured across the organization can be challenging. The Metrics Layer, also known as a Semantic Layer, is a critical component of the modern data stack that has recently received significant industry attention offers a powerful solution to the challenge of standardizing metric definitions. By serving as a centralized repository for standardized business metric definitions, the Metrics Layer enables decision-making that is both consistent and democratized. These metric definitions contain the logic used to calculate metric values that can then be leveraged for a range of analytical use cases including experimentation, machine learning, exploratory analysis, and reporting. Standardized metric definitions also enable different personas such as Data Scientists, Engineers and Product Managers to more easily use the same metric definitions and ensure that they are all measuring metrics in a consistent and accurate way.
Experimentation is one of the primary use cases that relies on metrics. The impact of experiments such as A/B tests and switchback tests is typically assessed by measuring the changes in metrics. A centralized metrics layer ensures accurate and reliable measurement of experiment results and streamlines the analysis process by minimizing the need for ad-hoc analysis. Additionally, having a centralized repository of metrics facilitates easy access to metrics, empowering all members of an organization to analyze experiment results. Experimentation is embedded into DoorDash's product development and growth strategy, and we run a lot of experiments with different features, products, and algorithms to improve the user experience, increase efficiency, and also gather insights that can be used to power future decisions. We have our in-house experimentation analysis platform called Curie, which automates and unifies the process of analyzing experiments at DoorDash. It allows our product teams to quickly iterate on their features by evaluating the impact of experiments on key business metrics using our robust statistical methodologies.
Building a metrics layer that works for experimentation is not simple, as it should support different types of metrics of varying scale that are used across the diverse range of A/B tests that are being run across different products. In this article, we will focus on the importance of the Metrics Layer and how it can improve the scalability and speed of the decision-making process, by discussing our journey of building one for Curie. We will also dive deep into our design and implementation processes and the lessons we learnt.
Challenges of ad-hoc SQLs
Our initial goal with Curie was to standardize the analysis methodologies and simplify the experiment analysis process for data scientists. As we mentioned in our previous blog, we began with a 'Bring Your Own SQL' method, in which data scientists checked in ad-hoc Snowflake (our primary data warehouse) SQL files to create metrics for experiments, and metrics metadata was provided as JSON configs for each experiment. This approach provided maximum flexibility for users, as they didn't have to change much in their workflow, and most were already using similar ad-hoc SQLs to manually analyze their experiments.
However, as Curie gained more adoption, we encountered several other challenges with our approach, which are discussed below:
Lack of standardization
At DoorDash, various teams run experiments to optimize a common set of business metrics. However, there was no standardized way to define metrics, leading to inconsistencies in how the same metric was defined across different teams. The lack of a single source of truth for metrics posed a risk of incorrect business decisions. The ad-hoc SQL approach required data scientists to write their own SQL for defining metrics, and those SQLs were neither easily discoverable nor reusable by the other teams.
Domain knowledge dependency
This challenge created a heavy reliance on subject matter experts (SMEs), who have a deep understanding of the metrics and SQL expertise. This dependency created challenges in democratizing metrics, as the required domain knowledge was often siloed within particular teams, and it was not easy for users to identify the relevant tables, columns, or query functions for specific metrics. Dependency on SQL made it challenging for non-technical users to analyze experiments without assistance from data scientists. As a result, product stakeholders were often blocked by the limited data scientists' bandwidth.
Unscalable metric computations
The use of ad-hoc SQLs for metric computations in the Curie platform also posed scalability challenges. The SQLs were monolithic in nature and included multiple metrics and dimensions, resulting in complicated joins and full-table scans that severely impacted the performance of our platform. There were too many redundant computations, as the same metric was often computed repeatedly for various experiments. This led to high analysis queueing times due to expensive queries blocking our worker queues, which caused frustration to the users, ultimately slowing their decision-making process. The platform team had limited levers to improve the performance, and adding more resources was the only option for scaling.
Unreliable results
There were concerns about the reliability of the experiment results displayed on Curie. The lack of tracking for the quality and freshness of upstream datasets used in the metric definitions posed a risk of basing important business decisions on outdated or low-quality data.
Limited features
The scalability challenges also impeded the implementation of advanced features, such as automated dimensional analysis for slicing and dicing the results by qualitative attributes. We were unable to platformize special analysis features such as CUPED for variance reduction, metrics pre-experiment bias checks, and others due to the limitations. This limitation created roadblocks in our ability to innovate and ultimately hindered our ability to derive more value from Curie.
Lack of governance
Our platform lacked governance policies for metric definitions. There was no clear ownership for metrics, and there was no formal review or approval process for making definition changes. Metadata for each metric was included in the experiment configuration and could be adjusted at the analysis level, which led to inconsistencies in how metrics were used across different teams.
We identified that the challenges we faced were primarily caused by the lack of metrics standardization, centralization, and scalability of our metrics computation. To tackle these issues, we proposed building a centralized metrics layer for experimentation and redesigning our metrics computation framework from scratch.
How we implemented different pillars of our Metrics Layer
In this section, we will delve deeper into our approach to various aspects of our metrics layer design, including its core data models and metrics computation engine.
Core Data Models / Semantics
We placed a strong emphasis on identifying the most comprehensive and effective core data models for users to create their own metrics. We took into account several key factors:
Metric attributes
In essence, a metric definition should include basic metadata, source tables, data warehouse columns to fetch data, and calculation logic for necessary aggregations and filters. Data scientists are the primary metric creators and are already familiar with SQL, so it made sense to use SQL as the language to define metrics instead of building our own DSL.
Data modeling
Our platform requires access to data at the raw fact or event level, not just the aggregates. This requirement enables us to perform accurate filtering and event-level dimensional analysis.
Dimensions
Dimensions should be defined separately as first-class citizens and not combined with metrics. Joins between metrics and dimensions should be constructed at the consumption stage for maximum flexibility.
Generalizability
Integration with the Curie platform was a top priority, but we also made sure to keep experimentation concepts out of the core data models as they have to be generic enough to be used for other analytical use cases in the future.
After considering the aforementioned factors and studying other existing metric frameworks, we decided to adopt standard BI data models. Users will be defining the following two models: Data sources and metrics.
Data sources
A data source represents a dataset that can be represented by a table or a SELECT SQL statement. It exposes a set of columns as measures or dimensions.
Measures
As with standard BI modeling, "measures" refer to quantitative values that represent specific aspects of events or facts. These measures are later aggregated to create metrics. Measures are always defined at the most granular level possible without any aggregations. This level of detail allows the platform to access raw events and perform accurate filtering and dimensional analysis. For example, while evaluating the number of orders metric in an experiment, the platform can automatically count only deliveries made by a user after their time of first exposure to the experiment. Platform can also slice and dice the metric across different dimensional cuts of the deliveries
An example source defining measures for delivery metrics
source:
  name: deliveries
  alias: Delivery Measures
  description: This source contains all the deliveries [including canceled deliveries].
    delivery_id is a primary key for this source and the timestamp is in UTC.
  tags:
    - kpi
  entity_units:
    - name: delivery_id
      primary: true
    - name: consumer_id
  measures:
    - name: n_delivery
      description: Measure for delivery event
    - name: delivery_profit
      description: Profit from deliveries made by a consumer in dollars
    - name: completed_delivery
      description: A delivery which was not canceled
  compute:
    sql: |-
      SELECT
        delivery_id,
        to_char(consumer_id) AS consumer_id,
        1 AS n_delivery,
        CASE WHEN dd.cancelled_at IS NULL THEN 1 END AS completed_delivery,
        profit/100 AS delivery_profit,
        created_at AS event_ts
      FROM prod.public.fact_deliveries
      WHERE event_ts::DATE BETWEEN {{start_date}} AND {{end_date}}
    dependencies:
      - prod.public.fact_deliveries
    look_back_period: 90
  owners:
    - arunkumar
An example source defining measures for delivery metrics
Dimensions
Dimensions are the qualitative attributes of an event or an entity which can be used for slicing and dicing the metrics results of an experiment.
source:
  name: core_consumer_dimensions
  alias: User level Dimensions
  description: Core dimensions for consumers
  entity_units:
    - name: consumer_id
      primary: true
  dimensions:
    - name: country
      description: Consumer's most recent country of app usage
    - name: platform
      description: Device platform where the consumer was last active (ios/android/web)
  compute:
    sql: |-
      SELECT
          to_char(du.consumer_id) AS consumer_id,
          dc.name AS country,
          du.platform AS platform,
          active_dt AS active_date
      FROM proddb.public.dimension_users du
      LEFT JOIN geo.public.dimensions_country dc
          ON du.country_id = dc.id
      WHERE active_date BETWEEN {{start_dt}} AND {{end_date}}
    dependencies:
      - prod.public.dimension_users
      - geo.public.dimensions_country
  owners:
    - arunkumar
An example source defining dimensions for consumer entity
In addition to measures and dimensions, sources also contain entity units, which can be used as join keys with other sources or experiment assignment logs. These entity units often include IDs such as consumer_id, dasher_id, and delivery_id, which will also be used as bucket keys or randomization units for experiments. It also includes a timestamp column defined in its SQL statement, indicating either the timestamp at which the event occurred (in the case of measures) or the active date of an entity dimension. Other metadata required for computation is also included, such as upstream table dependencies for orchestration, the lookback period for incremental computations, tags for discoverability and ownership identities.
Metrics
Metrics are created by aggregating the measures defined in the source, and we support various types of metrics such as normal aggregations, ratios, and window metrics. Users can include basic metadata and experimentation settings such as covariates in their metric definitions. For example, in the below illustration, we see that ML predictions are set as a covariate for variance reduction using CUPAC. Additionally, users can create window metrics as derived metrics by just extending the main metrics with additional window configs, making it easier for users and capturing the lineage between the parent and derived metrics. For instance, the below example demonstrates how users define a 7-day window metric to analyze how users convert within seven days of being exposed to an experiment.
metric:
  name: conversion_rate
  alias: Order Rate
  description: number of orders placed within a period
  desired_direction: INCREASE
  spec:
    type: RATIO
    numerator:
      measure: n_checkouts
      aggregation: COUNT
    denominator:
      measure: n_visits
      aggregation: COUNT
  window_metrics:
    - name: conversion_rate_exposure_7d
      window_params:
        window_type: EXPOSURE
        lower_bound: 0
        upper_bound: 7
        window_unit: DAY
  curie_settings:
    covariates:
      - conversion_rate_predictions
  owners:
    - arunkumar
An example conversion rate ratio metric definitions along with its derived window metrics
Subscribe for weekly updates
Authorship and governance
Authoring metrics involves creating the above core models as YAML files and uploading them to GitHub for proper source control. This process makes it simple for users to assess and validate the metric definitions before they are applied in any experimental analysis. With GitHub we facilitate a streamlined review process, guaranteeing both technical and business accuracy in the definitions.
The changes made to the models undergo a series of automated validations in addition to the manual audit. These checks run as part of the CI (Continuous Integration) process for pull requests, including validation of the entity units, uniqueness checks for metrics, dimensions, sources, and SQL validations to confirm the presence of required measure and timestamp columns in the result set, and more. These validation checks are very helpful in finding and flagging any common user errors that could later break the computation pipelines. If the pull request passes all the validations and receives the required approval, the updated definitions are synced to the system and made available for experiment analysis within minutes. An internal GRPC service hosts these definitions and serves them to the experimentation platform and metric computation pipelines via API as shown in Figure 1.

Metric Packs for improved governance
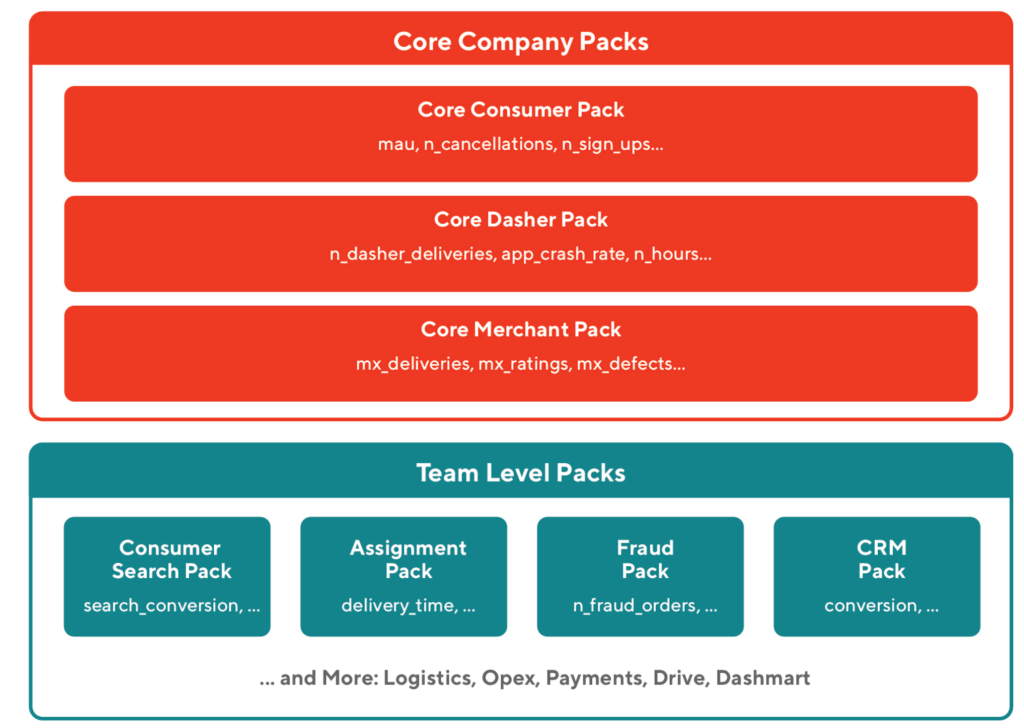
We introduced another abstraction called “Metrics Packs,” which are standardized collections of metrics. These packs, built and approved by specific teams, simplify the usage and promote standardization of metrics. Teams can construct a standard set of metrics they are interested in, with configurable parameters such as covariates, metric labels, and dimensional cuts, and reuse them across multiple experiments without the need to reconfigure each time. This makes it easier for everyone on the team to quickly identify the metrics they need to monitor and also ensures that experiments are evaluated consistently against standardized and agreed-upon criteria.
Metrics packs also enable the sharing of metric configurations across different teams and users. For example, both the search and ads teams can use the same metric pack to measure conversion metrics without having to work on the definitions and configurations multiple times. Furthermore, we created core metric packs containing critical company-level metrics that are automatically added to all experiment analyses based on the entity the experiment is randomized on. This ensures that the company's core metrics are consistently monitored for any adverse changes resulting from experiments.
Metrics computation engine
In addition to standardization, another main reason we built a metrics layer was to improve the scalability of metric computation for experimentation. Our ad-hoc SQL pipelines included a lot of redundant computations because oftentimes, each metric will be evaluated across multiple experiments, and they were being computed repeatedly. To address this challenge, with the metrics layer, we built a custom computation engine from the ground up to pre-compute the measures for all the metrics and reuse these computed data assets in the analysis pipelines. As a result, we eliminated the inefficient table scans and joins, which are resource-intensive operations on Snowflake.
Measures pre-computation
Our metrics computation engine dynamically generates data pipelines based on the models created by the users. For each source model, we build a daily Dagster job to incrementally compute and materialize the measures defined in it into a Snowflake table ([A] in Figure 3). The choice of using Dagster as our orchestration engine was driven by its features, such as a declarative data asset-aware approach to orchestration, intuitive APIs for building pipelines, support for running backfills from the UI, a native multi-tenant architecture that enables seamless running of multiple use-cases, a robust web interface, and powerful GraphQL API support, among others.
To ensure that our pipeline stays up-to-date, we have built Dagster job generators that periodically track changes to our models using our backend APIs and automatically build or modify the required jobs. The upstream dependencies for all jobs are automatically inferred from the models and orchestrated. We generate a Dagster sensor for each source job that periodically checks the status of the latest partition of the upstream tables and triggers the corresponding source job once the data partitions are available. The jobs also handle database migrations on Snowflake by creating new tables according to the types of measures and identifiers defined in the source SQL, and also automatically adding new columns for any new measures.
These automations ensure that any changes made to the models are reflected in the data pipelines within minutes without the need for manual intervention. From the user's perspective, this results in a significant increase in velocity, as data scientists can add new metrics and use them in their experiments within minutes, without the support of the infrastructure team.
We adopted the Functional Data Engineering paradigm by designing all our jobs to be idempotent, logically partitioned by dates, and treating those partitions as immutable. Each job run would be assigned a set of partitions that it needed to overwrite using Dagster run-config. This pattern allowed manual or automated backfills to be run in a repeatable manner by passing the required date range in the job run configuration. Additionally, all jobs are lookback aware, and our daily job runs automatically backfill data for prior dates based on the lookback period defined in the source model. The lookback period is usually defined by the users based on how many date partitions are updated daily in the upstream tables. We have also designed our pipelines to be self-healing so that when a job fails to run on certain days, the next pipeline run will try to systematically catch up and backfill all unprocessed data based on the last updated timestamp. These steps ensure that our data is always up-to-date and complete.

Metric computation and experiment analysis
Once the raw measures are computed, our orchestration engine triggers the aggregation data pipelines for the metrics that are derived from those measures. At this stage ([B] in Figure 3), we run the auto generated SQL pipelines to join the measures with the experiment exposures (variant assignments of each randomization entity for an experiment) for each experiment and then compute the aggregates for the metric sliced by different variants of the experiment.
Most of the inferences in our stats engine are performed using the Delta method which operates directly on moment aggregates at the experiment level. This process means that we don’t need to move a huge volume of raw data into our platform and instead we can compute the experiment variant level aggregates directly on Snowflake and only fetch the aggregates for our statistical analysis.
We also perform automated variance reduction using CUPED within the platform for all the analyzed metrics. Variance reduction is a process used to increase the power or sensitivity of the experiment and CUPED is a common and powerful variance reduction methodology that uses pre-experimental average metric values as covariates. At this stage, we also compute and fetch the required cross-moment aggregates for the pre-experiment covariates of each metric. The covariates used in CUPED are computed from the same measures and computation logic that were used for the actual metric computation but only with a different time range to get the data for the pre-experiment period. We use a similar time-shifted metric computation to perform pre-experimental bias testing for different experiments to detect any systematic difference in the behavior of the treatment and control groups before the experiment starts.
Impact of implementing a Metrics Layer - Improved Experimentation
- With our standardization efforts, we enabled teams to create standard sets of metrics that could be shared and reused across different teams consistently. By removing the SQL requirement, we empowered non-technical stakeholders to analyze A/B tests without much supervision using our curated core metric packs.
- Our efficient metric computation framework resulted in a 10x improvement in the average experiment analysis time compared to our previous ad-hoc SQL approach allowing faster time-to-insights.
- We were able to implement multiple advanced features such as automated CUPED variance reduction, automated pre-experiment bias check, and dimensional analysis leading to faster and more accurate decisions.
- We improved the reliability and overall quality of our experiment results by tracking upstream dependencies delays and failures and enabling basic data quality checks.
Learnings from implementing a metrics layer for Experimentation
User education increases adoption
In order to promote the adoption of the Metrics Layer, it is important to educate users on the benefits of standardized metrics. These benefits can be communicated through user education sessions and practical boot camps. By demonstrating the impact of improved performance and the reusability of metrics, users will fully appreciate the value. In particular, it helps to stress how Data Scientists can benefit from the ability to enable non-technical stakeholders to analyze experiments using standard metrics without requiring much guidance so that they can spend their time on other objectives like studying trends, exploratory analysis to gain insights, building ML models, etc.
Performance is the key
To encourage users to adopt standard metrics, it is crucial for the metrics layer to provide reliable and fast performance with low-latency access. Poor performance can drive users towards ad-hoc SQL solutions. Prioritizing low-hanging optimizations can improve performance significantly. Adopting good data engineering practices like designing incremental pipelines by default, building and using pre-aggregates, creating temporary staged tables to minimize table scans like building separate exposure tables for each experiment to reduce repeated scans on our monolithic exposures table, and enabling batched measure backfills improved the performance in our case significantly.
Balancing customization and standardization
In order to cater to the diverse needs of DoorDash's experiment and metrics, it's important to prioritize flexibility and customization over rigid, one-size-fits-all approaches. We included features such as the ability to quickly change the analysis or metric configurations and re-trigger on-demand computation, and enhanced filtering capabilities (e.g. filtering on dimensions, date ranges, and experiment versions). Additionally, allowing users to enter SQLs or custom exposure tables provided an escape hatch for users to conduct triggered analysis and improve the sensitivity of their experiments instead of including all the exposures that could not have been impacted by the experiment.
Empowering users for self-debugging of analyses
Custom SQL analyses are typically more intuitive and easier for users to debug, but standard metrics computation pipelines can often involve multiple intermediate steps, such as staging exposure tables and precomputed measures, which can make it difficult for users to understand and troubleshoot issues. The platform should provide users with access to any relevant information to help them resolve analysis issues on their own. Such information may include clear visual representations of pipeline steps, access to SQL queries and job logs for each step, real-time progress updates of the pipeline, and error/warning notifications on the user interface. We also auto-generate a web based notebook for analytics that users can use to replicate the same metric analysis in and deep dive into the results. These efforts can also help reduce the on-call burden for the experimentation team
Pre-aggregation vs flexibility
Pre-aggregations can significantly improve query performance but may come at the cost of flexibility. By pre-aggregating metrics, we may lose the ability to query raw data, and computing and storing unused aggregates can become expensive because we often might not know all the query patterns beforehand. Thus, it is crucial to strike a balance between pre-aggregation and flexibility. Initially, we pre-computed and stored aggregates for metrics across different entity units such as user_id and dasher_id. However, we found that most of these aggregates were unused and the latency benefit was not very high when compared to the cost of computing them. Currently, we are evaluating other OLAP engines like Pinot to manage pre-aggregation more intelligently.
Data movement is always expensive
Data movement is a costly operation, especially when dealing with large volumes of data, and it can result in high network latency. Thus, it's essential to minimize data movement by moving computations closer to the data source whenever possible. For instance, by performing aggregate computations directly in Snowflake and retrieving only the resulting aggregates instead of raw events, we were able to significantly reduce our overall pipeline latency by 50% and cut cloud infrastructure costs associated with analyzing large data volumes by almost 50%. We achieved this by rewriting our computations in SQL, but when it is not possible with SQL, Snowflake's feature called Snowpark can be used to perform more complex data processing directly in Snowflake without having to move data to external systems.
Conclusion
At DoorDash we strongly believe in the value of a centralized metrics store and its potential to improve and standardize data-driven decision-making. Our approach has enabled us to author, govern, and compute metrics in a scalable and standardized way for experimentation, overcoming challenges we faced with our previous ad-hoc SQL approach. We believe that our insights and the impact we have achieved will serve as a proof for the benefits of metrics standardization and we hope it encourages others to consider adopting a metrics layer in their organizations. Furthermore, the details we have provided on our semantic models, computation framework, and experimentation platform integration are generalizable and can be useful to those who are looking to integrate their own or an external metrics layer with their experimentation framework.
While our focus has been on the experimentation use case, metrics standardization has broader applications across other data-driven use cases as well. We are continuing our work to replicate our success in other areas like business intelligence, exploratory analysis, forecasting, etc., and are committed to realizing the full potential of our Metrics Layer. In future blogs, we will talk more about our advanced features such as our automated dimensional analysis for experiment results and our progress on non-experimentation use cases.
Acknowledgements
Acknowledgements
Special thanks to Sagar Akella, Bhawana Goel, and Ezra Berger for their invaluable help in reviewing this blog article. Additionally, I would like to extend my gratitude to the Experimentation team, specifically Caixia Huang, Drew Trager, Michael Zhou, Sharon Weng, Stas Sajin, Wilson Liu and Yixin Tang, for their collaboration in building some of the amazing features detailed in this article


