

When dealing with failures in a microservice system, localized mitigation mechanisms like load shedding and circuit breakers have always been used, but they may not be as effective as a more globalized approach. These localized mechanisms (as demonstrated in a systematic study on the subject published at SoCC 2022) are useful in preventing individual services from being overloaded, but they are not very effective in dealing with complex failures that involve interactions between services, which are characteristic of microservice failures.
A novel way to deal with these complex failures takes a globalized view of the system: when an issue arises, a global mitigation plan is automatically activated that coordinates mitigation actions across services. In this post, we evaluate the open-source project Aperture and how it enables a global failure mitigation plan for our services. We first describe the common types of failures we have experienced at DoorDash. Then we dive into the existing mechanisms that have helped us weather failures. We will explain why localized mechanisms may not be the most effective solution and argue in favor of a globally aware failure mitigation approach. Furthermore, we will share our initial experiences using Aperture, which offers a global approach to address these challenges.
Classes of microservice architecture failures
Before we explain what we have done to deal with failures, let’s explore the types of microservice failures that organizations experience. We will discuss four types of failures that DoorDash and other enterprises have encountered.
At DoorDash, we view each failure as a learning opportunity and sometimes share our insights and lessons learned in public blog posts to show our commitment to reliability and knowledge sharing. In this section, we will discuss some common failure patterns that we experienced. Each section is accompanied by real outages drawn from our past blog posts that can be explored in greater detail.
Here are the failures we will detail:
- Cascading failure: a chain reaction of different interconnected services failing
- Retry storm: when retries put extra pressure on a degraded service
- Death spiral: some nodes fail, causing more traffic to be routed to the healthy nodes, making them fail too
- Metastable failure: an overarching term that describes failures that can’t self-recover because of the existence of a positive feedback loop
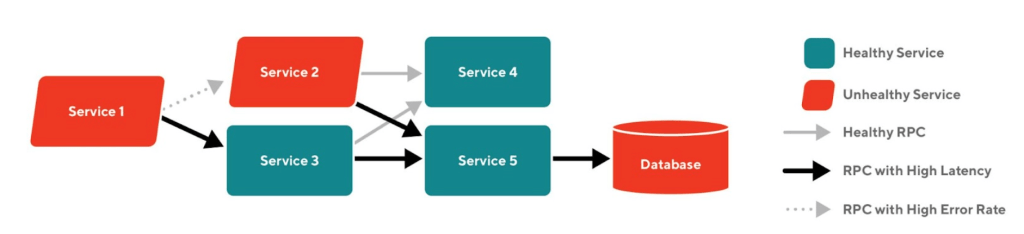
Cascading failure
Cascading failure refers to the phenomenon where the failure of a single service leads to a chain reaction of failures in other services. We documented a severe outage of this kind in our blog. In that case, the chain of failure started from a seemingly innocuous database maintenance, which increased the database latency. The latency then bubbled up to the upstream services, causing errors from timeouts and resource exhaustion. The increased error rates triggered a misconfigured circuit breaker, which stopped traffic between a lot of unrelated services, resulting in an outage with a wide blast radius.
Cascading failure describes a general phenomenon where failure spreads across services, and there is a wide range of ways a failure can transmit to another. Retry storm is one common mode of transmission among others, which we will dive into next.
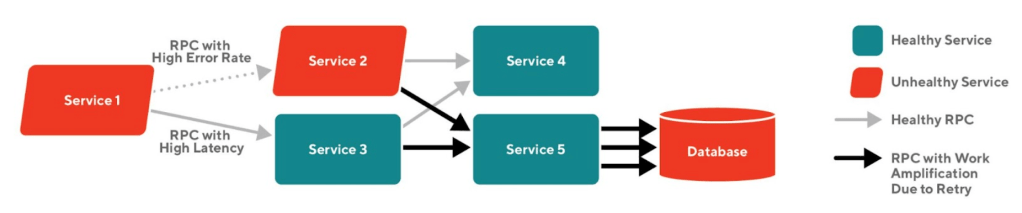
Retry storm
Due to the unreliable nature of Remote Procedure Calls(RPC), the RPC call sites are often instrumented with timeouts and retries to make every call more likely to succeed. Retrying a request is very effective when the failure is transient. However, retries will worsen the problem when the downstream service is unavailable or slow since in that case, most requests will end up being retried multiple times and will still ultimately fail. This scenario where excessive and ineffective retries are applied is called work amplification, and it will cause an already degraded service to degrade further. As an example, this kind of outage happened at an early stage of our transition to microservices: a sudden increase in the latency of our payment service resulted in the retry behavior of the Dasher App and its backend system, which exacerbated the situation.
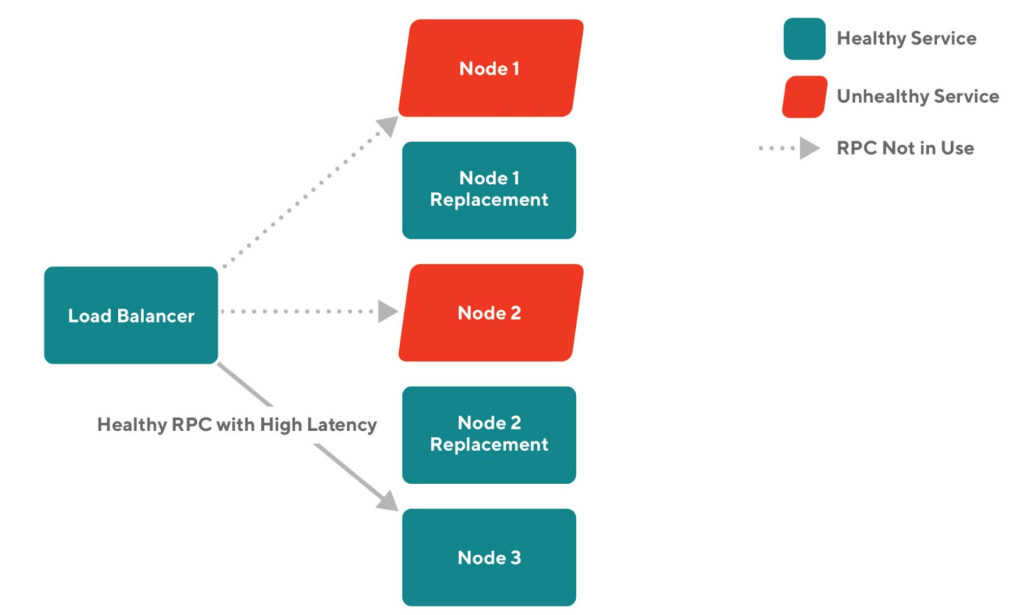
Death Spiral
Failures can frequently spread vertically through an RPC call graph across services, but they can also spread horizontally among nodes that belong to the same service. A death spiral is a failure that starts with a traffic pattern that causes a node to crash or become very slow, so the load balancer routes new requests to the remaining healthy nodes, which makes them more likely to crash or become overloaded. This blog post describes an outage that began with some pods failing the readiness probe and was thus removed from the cluster, and the remaining nodes failed since they were not able to handle the massive loads alone.
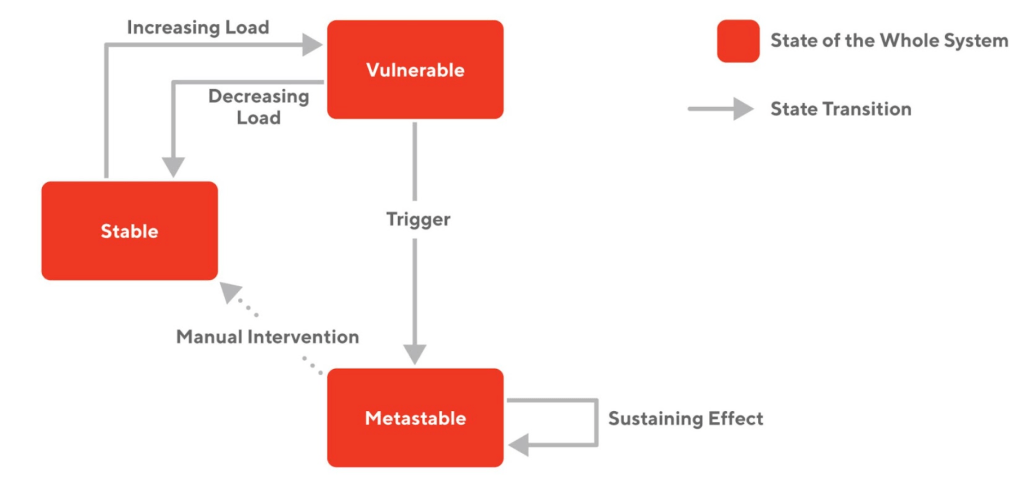
Metastable failures
A recent paper proposes a new framework to study distributed system failures, which is called a “metastable failure.” Many of the outages we experienced belong to this category. This type of failure is characterized by a positive feedback loop within the system that provides a sustaining high load because of work amplification, even after the initial trigger (e.g., bad deployment; a surge of users) is gone. Metastable failure is especially bad because it will not self-recover, and engineers need to step in to stop the positive feedback loop, which increases the time it takes to recover.
Local countermeasures
All of the failures documented in the section above are types of countermeasures that attempt to limit the impact of the failure locally within an instance of a service, but none of these solutions allow coordinated mitigation across services to ensure the overall recovery of the system. To demonstrate this we will dive into each existing mitigation mechanism we deployed and then discuss their limitations.
The countermeasures we will discuss are:
- Load shedding: which prevents degraded services from accepting more requests
- Circuit breaker: which stops outgoing requests when degraded
- Auto scaling: that can help with handling high load at peak traffic, but it’s only useful if it’s configured to be predictive rather than reactive
Next we will explain how all of these fault tolerance strategies work and then discuss their drawbacks and tradeoffs.
Load shedding
Load shedding is a reliability mechanism that rejects incoming requests at the service entrance when the number of in-flight or concurrent requests exceeds a limit. By rejecting only some traffic, we maximize the goodput of the service, instead of allowing the service to be completely overloaded where it would no longer be able to do any useful work. At DoorDash, we instrumented each server with an “adaptive concurrency limit” from the Netflix library concurrency-limit. It works as a gRPC interceptor and automatically adjusts the maximum number of concurrent requests according to the change in the latency it observes: when the latency rises, the library reduces the concurrency limit to give each request more compute resources. Additionally, the load shedder can be configured to recognize priorities of requests from their header and only accept high priority ones during a period of overload.
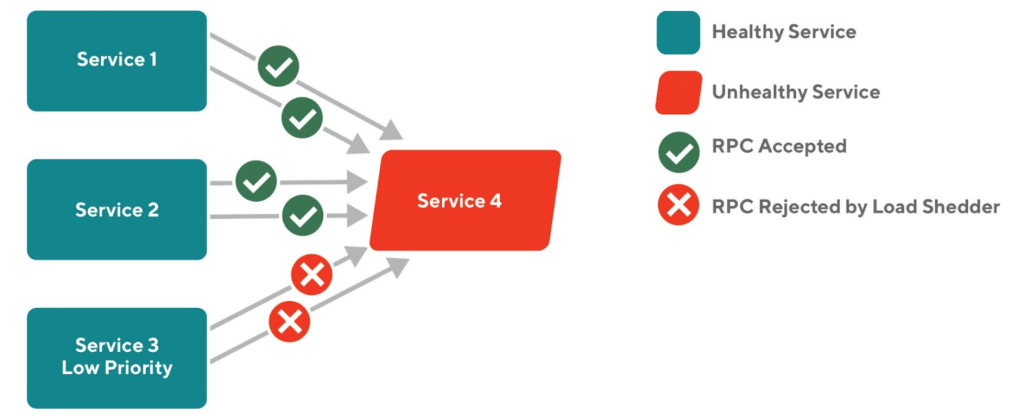
Load shedding can be effective in preventing a service from being overloaded. However, since the load shedder is installed at the local level, it can only handle local service outages. As we have seen in the previous section, failures in a microservice system often result from an interaction between services. Therefore, it would be beneficial to have a coordinated mitigation during an outage. For example, when an important downstream Service A becomes slow, an upstream Service B should start gating the requests before they reach A. This prevents the heightened latency from A to spread inside the subgraph, potentially causing a cascading failure.
Besides the limitation of the lack of coordination, load shedding is also hard to configure and test. Properly configuring a load shedder requires carefully orchestrated load testing to understand a service’s optimal concurrency limit, which is not an easy task because in the production environment, some requests are more expensive than others, and some requests are more important to the system than others. As an example of a misconfigured load shedder, we once had a service whose initial concurrency limit was set too high, which resulted in a temporary overload during the service’s startup time. Although the load shedder was able to tune down the limit eventually, the initial instability was bad and showed how important it is to correctly configure the load shedder. Nevertheless, engineers often leave these parameters to their default values, which is often not optimal for individual services’ characteristics.
Circuit breaker
While load shedding is a mechanism to reject incoming traffic, a circuit breaker rejects outgoing traffic, but like a load shedder it only has a localized view. Circuit breakers are typically implemented as an internal proxy that handles the outgoing requests to the downstream services. When the error rate from the downstream service exceeds a threshold, the circuit breaker opens, and it quickly rejects all requests to the troubled service without amplifying any work. After a certain period, the circuit breaker gradually permits more traffic to pass, ultimately returning to normal operation. We at DoorDash have built a circuit breaker into our internal gRPC client.
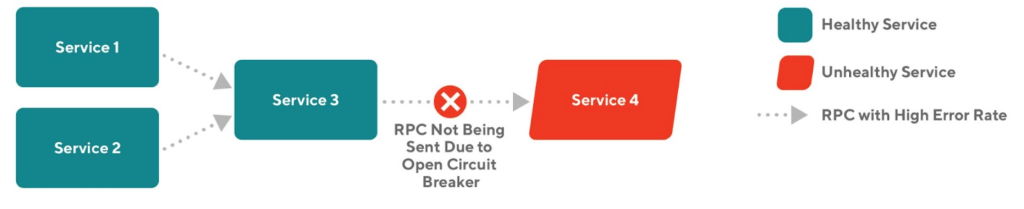
In situations where the downstream service is experiencing a failure but has the ability to recover if traffic is reduced, a circuit breaker can be useful. For example, during a death spiral in the formation, unhealthy nodes are replaced by newly started nodes that are not ready to take traffic, so traffic is routed to the remaining healthy nodes, making them more likely to be overloaded. An open circuit breaker, in this case, gives extra time and resources for all nodes to become healthy again.
Circuit breakers have the same tuning problem as load shedding: there is no good way for service authors to determine the tripping threshold. Many online sources on this subject use a “50% error rate” as a rule of thumb. However, for some services 50% error rate may be tolerable. When a called service returns an error, it might be because the service itself is unhealthy, or it might be because a service further downstream is having problems. When a circuit breaker opens, the service behind it will become effectively unreachable for a period of time, which may be deemed even less desirable. The tripping threshold depends on the SLA of the service and the downstream implications of the requests, which must all be considered carefully.
Subscribe for weekly updates
Auto-scaling
All cluster orchestrators can be configured with autoscaling to handle increases in load. When it’s turned on, a controller periodically checks each node’s resource consumption (e.g. CPU or memory), and when it detects high usage, it launches new nodes to distribute the workload. While this feature may seem appealing, at DoorDash we recommend that teams do not use reactive auto-scaling (which scales up the cluster in real time during a load peak). Since this is counterintuitive, we list the drawback of reactive auto-scaling below.
- The newly launched nodes need time to warm up (fill caches, compile code, etc.) and will exhibit higher latency, which temporarily reduces cluster capacity. Also, the new nodes will run costly startup tasks such as opening database connections and triggering membership protocols. These behaviors are infrequent, so a sudden increase in them may lead to unexpected results.
- During an outage that involves a high load, adding more capacity to one service will often just move the bottleneck to somewhere else. It typically does not solve the problem.
- Reactive auto-scaling makes it harder to do post-mortem analysis, as the timeline of metrics adjusts in various ways to both the incident, whatever actions humans are taking to mitigate, and the auto-scaler.
Therefore, we advise teams to avoid using reactive auto-scaling, preferring instead to use predictive auto-scaling such as KEDA’s cron that adjusts a cluster’s size based on expected traffic levels throughout the day.
All of these localized mechanisms are good at dealing with different failure types. However being localized has its own downsides, now we are going to dive into why localized solutions can only get you so far and why a globalized observation and intervention would be preferable.
Shortcomings of existing countermeasures
All the reliability techniques we employ have a similar structure consisting of three components: measurement of operational conditions, identification of problems through rules and settings, and actions to take when issues arise. For example, in the case of load shedding, the three components are:
- Measure: calculates the recent history of service latency or errors
- Identify: uses mathematical formulas and pre-set parameters to determine if the service is at risk of being overloaded
- Action: denies excess incoming requests
For circuit breaker, they are:
- Measure: evaluates downstream service’s error rate
- Identify: checks if it exceeds a threshold
- Action: stops all outgoing traffic to that service
However, existing localized mechanisms suffer from similar shortcomings in that:
- They use the metrics that are local to the service to measure operating conditions; however, many classes of outages involve an interaction between many components, and it requires one to have a global view of the system to make good decisions about how to mitigate the effects of an overload condition.
- They employ very general heuristics to determine the system's health, which is often not precise enough. For example, latency alone can not tell whether a service is overloaded; a high latency could be caused by a slow downstream service.
- Their remediation actions are limited. Since the mechanisms are instrumented locally, they can only take local actions. Local actions are usually not optimal for restoring the system to a healthy state since the true source of the problem might be elsewhere.
We are going to discuss how to overcome these shortcomings and make the mitigation more effective.
Utilizing globalized controls: Aperture for reliability management
A project that moves beyond local countermeasures to implement globalized load control is implemented by Aperture, an open-source reliability management system. It provides a reliability abstraction layer that makes reliability management easier across a distributed microservice architecture. Unlike existing reliability mechanisms that can only react to local abnormalities, Aperture offers a centralized load management system that enables it to coordinate many services in response to an ongoing outage.
Aperture’s design
Like existing countermeasures, Aperture monitors and controls the system's reliability with three key components.
- Observe: Aperture collects reliability-related metrics from each node and aggregates them in Prometheus.
- Analyze: An independently running Aperture controller is constantly monitoring the metrics and tracks deviation from SLO
- Actuate: If there are any abnormalities, the Aperture controller will activate policies that match the observed pattern and apply actions at each node, like load shedding or distributed rate limiting.
Our experience using Aperture
Aperture is highly configurable in how it detects and acts to the system abnormalities. It takes in policies written in YAML files that guide its actions during an outage. For example, the code below, taken from Aperture doc and simplified, computes the exponential moving average (EMA) latency. It takes latency metrics from Prometheus and triggers an alert when the calculated value is over a threshold.
circuit:
    components:
      - promql:
          evaluation_interval: 1s
          out_ports:
            output:
              signal_name: LATENCY
          query_string:
            # OMITTED
      - ema:
          ema_window: 1500s
          in_ports:
            input:
              signal_name: LATENCY
          out_ports:
            output:
              signal_name: LATENCY_EMA
          warm_up_window: 10s
      - decider:
          in_ports:
            lhs:
              signal_name: LATENCY
            rhs:
              signal_name: LATENCY_SETPOINT
          operator: gt
          out_ports:
            output:
              signal_name: IS_OVERLOAD_SWITCH
      - alerter:
          alerter_config:
            alert_name: overload
            severity: crit
          in_ports:
            signal:
              signal_name: IS_OVERLOAD_SWITCH
    evaluation_interval: 0.5s
When an alert is triggered, Aperture automatically executes actions according to the policies it is configured with. Some of the actions it currently offers include distributed rate limiting and concurrency limiting (aka load shedding). The fact that Aperture has a centralized view and control of the entire system opens up numerous possibilities for mitigating outages. For example, one can configure a policy that sheds loads on an upstream service when a downstream service is overloaded, allowing the excessive requests to fail before reaching the problematic subgraph, which makes the system more responsive and saves costs.
To test out Aperture’s capability, we ran a deployment of Aperture and integrated it into one of our primary services, all within a testing environment and found it to be an effective load shedder. As we increased the RPS of the artificial requests sent to the service, we observed that the error rate increased, but the goodput remained steady. On a second run, we reduced the compute capacity of the service, and this time we observed that the goodput reduced, but the latency only increased slightly. Behind the scenes of both runs, the Aperture controller noticed an increase in latency and decided to reduce the concurrency limit. Consequently, our API integration in our application code rejected some of the incoming requests, which is reflected by an increased error rate. The reduced concurrency limit ensures that each accepted request gets enough compute resources, so the latency is only slightly affected.
With this simple setup, Aperture basically acts as a load shedder, but it is more configurable and user-friendly than our existing solutions. We are able to configure Aperture with a sophisticated concurrency limiting algorithm that minimizes the impact of unexpected load or latency. Aperture also gives an all-in-one Grafana dashboard using Prometheus metrics, which provides a quick glimpse of the health of our services.
We have yet to try out the more advanced features of Aperture, including the ability to coordinate mitigation actions across services and the possibility of having escalation policies in which autoscaling is triggered after a sustained load. Evaluating these features requires more elaborate setups. That being said, a reliability solution is best tested out in the production environment where real outages happen, which are always unpredictable.
Aperture integration details
It’s worth a deeper dive into how Aperture is integrated into an existing system. A deployment of Aperture consists of the following components:
- Aperture controller: this module is the brain of the Aperture system. It constantly monitors the reliability metrics and decides when to execute a mitigation blueprint. When a blueprint is triggered, it sends the appropriate actions (e.g. load shedding) to the Aperture agent.
- Aperture agent: each Kubernetes cluster runs an instance of Aperture agent, which is in charge of tracking and ensuring the health of the nodes running in the same cluster. When a request comes into a service, it will be intercepted by an integration point, which forwards the relative metadata to an Aperture agent. The Aperture agent records the metadata and replies with a decision of whether to accept the request. Such a decision is based on the information given by the Aperture controller.
- Integration point: services that want to benefit from centralized reliability management can integrate with Aperture in three ways. If the services are built on a service mesh (currently only supporting Envoy), Aperture can be deployed on the service mesh directly without changing the application code. There are also Aperture SDKs that one can use to integrate application code with Aperture endpoints. For Java applications, one can also use Java Agent to automatically inject Aperture integration into Netty. To illustrate what this integration does, below is a code snippet that demonstrates how to use the Aperture SDK in Java.
- Prometheus & etcd: these are databases that store the reliability metrics and are queried by the Aperture controller to get a measure of the current operating condition.
private String handleSuperAPI(spark.Request req, spark.Response res) {
    Flow flow = apertureSDK.startFlow(metadata);
    if (flow.accepted()) {
        res.status(202);
        work(req, res);
        flow.end(FlowStatus.OK);
    } else {
        res.status(403);
        flow.end(FlowStatus.Error);
    }
    return "";
  }
Conclusion
Existing reliability mechanisms are instrumented at the local level of individual services, and we have shown that globalized mechanisms work better at dealing with outages. In this blog, we showed why keeping a microservice system running reliably is a challenging problem. We also give an overview of our current countermeasures. These existing solutions effectively prevent many outages, but engineers often poorly understand their inner workings and don’t configure them optimally. Additionally, they can only observe and act inside each service, which limits their effectiveness in mitigating outages in a distributed system.
To test out the idea of using globalized mechanisms to mitigate outages, we investigated the open-source reliability management project Aperture. This project elevates reliability management to a primary component of the system by centralizing monitoring and controlling responsibilities rather than having them handled by individual services. By doing so, Aperture enables automated, efficient, and cost-effective methods for addressing outages. We had a positive experience during our initial trial, and we are excited by its potential.


 JoshZhu


 QixuanWang
