
DAX-JUNGLE: SELECTCOLUMNS

It’s a jungle out there
Back in the day- when I was stuck on a DAX problem, I used to toggle through the IntelliSense in PowerBI one letter at a time. I’ve learned much since then and in this blog I’d like to share my experience with using PATH in Dax.
A:
ABS
ACOS
ACOSH
…
B:
BETA.DIST
BETA.INV
BLANK
Etc….
Hours wasted..
Mistakes were made
A MUCH better use of my time would have been reviewing quality solutions to real world problems.
So that’s what we’ll do. Real problems, real DAX.
The Basics: SELECTCOLUMNS
SELECTCOLUMNS is a very simple function whos primary purpose is convenience and efficiency during development. However, there are some very cool tricks we can accomplish using this function.
Below I am going to explore two problems. One explores a very simple but common case that we can encounter that SELECTCOLUMNS can resolve for us. The second takes a different look at how we can visualize the results we want and then SELECTCOLUMNS to return a single value from a calculated table.
Multiple keys for single dimensions:
This first use for SELECTCOLUMNS comes from a common case where two columns can appear in a fact table with IDs referring to one dimension table.
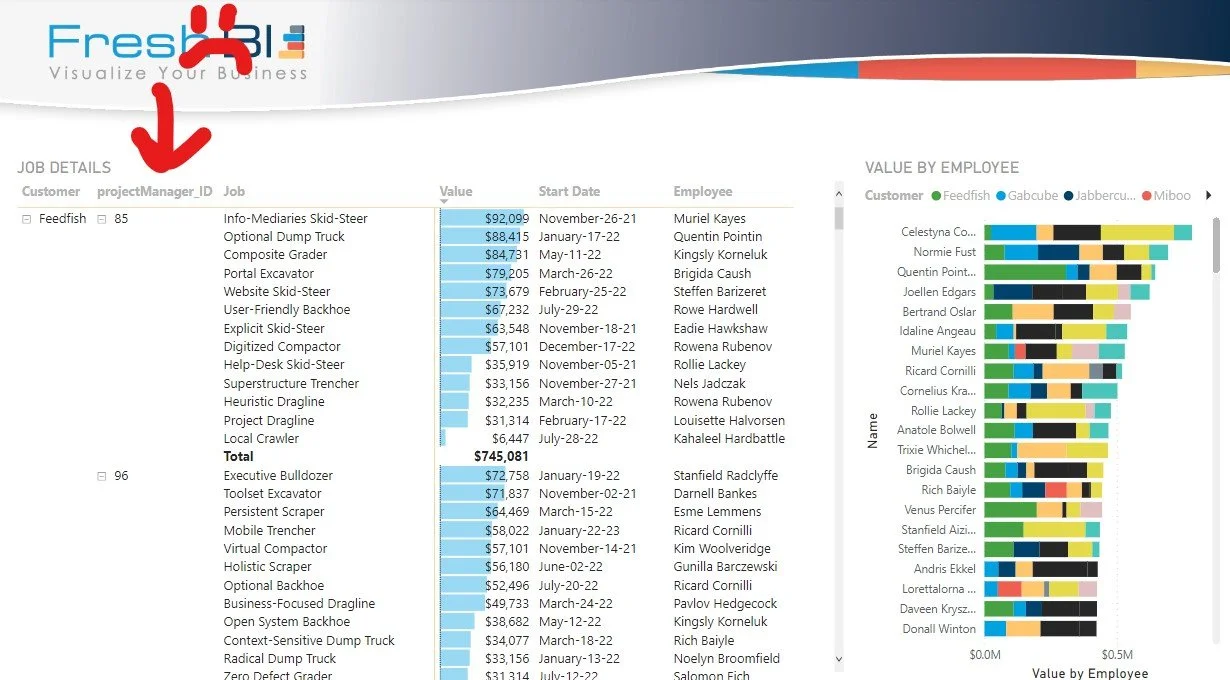
Below, I have a simple data model, we can see we have an Employees table joined to fact table “Jobs” by the employee ID. A quick look at the Employees table, we can see that a column “is project manager” exists, so some of the rows in our Employees table are project managers. Now turn your attention to the “Jobs” table, we have ID’s for both Employee, and Project Manager.


The problem:
Right now, we can only display the full name of Employees, but not Project Managers. This is a problem!
A solution is to duplicate our Employee table and then create a relationship between this new Employees table, and Jobs on the projectManager_id field.
We have options:
We can duplicate our query in Power Query
Pros:
Consistent table source process
Cons:
Table data must load twice during data refresh.
Changes to one Power Query process might need to be duplicated.
Full copy may include columns that aren’t necessary.
We can create a DAX table full copy.
Pros:
Refresh times will not be effected: Power BI only loads the employee table once
Reducing clutter in Power Query.
Same file size impact as 1.
Cons:
Full copy may include columns that aren’t necessary.
We can use SELECTCOLUMNS to create a subset of the Employees table.
Pros:
Refresh times will not be effected: Power BI only loads the employee table once
Reducing clutter in Power Query.
Reduced file size impact.
Cons:
?
I’ve left out the option for creating a reduced table in Power Query, because it gets pushed behind by the pros and cons above.
My conclusion is that 3. will usually be the best option. So lets look at how this would work in practice.
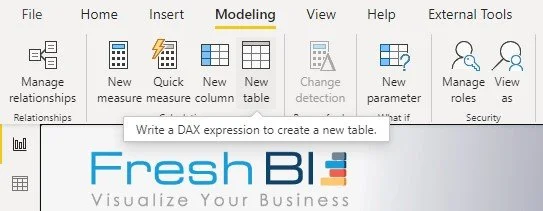
Step 1: Create our new table:
This step is very easy. First, we are going to find the “New table” button in our Power BI toolbox and click it.
Here we are going to start typing our SELECTCOLUMNS statement. In this case all we will start with the “id” and “Name” fields. The syntax for the SELECTCOLUMNS requires only a few pieces. First we identify the table we are selecting from, second we provide new aliases, and items to select. Below, am selecting “id” , and “Name” each as their names respectively, from the “Employees” table.

Step 2: Reduce:
Now lets look and see if we could reduce this further. Right now, if we used our new table in a slicer, we would still have all employees as options. This is not ideal; lets add the “Is Project Manager” field to our select functions. Now we can filter this new table to only PM’s.

I think we can do better here. If we include the “Is Project Manager” field, we are increasing storage size, AND we are still storing non Project Managers in our DAX table.
Lets add a filter in the DAX table itself. By changing our table we are referencing from “Employees” to “FILTER(“Employees”,”Employees”[Is Project Manager]) we are pre filtering our select results. Hence we have a table of just Names and ids for Project Managers.

Step 3: Data modeling:
Last step here will be to relate our new table to the Jobs table on its respective id, and then use our new dimension table in our report!


Summary:
The big take away here, is that this really is a simple problem to resolve, but the SELECTCOLUMNS function lets you solve it FAST, and without breaking your Power BI workflow. This can be key to keeping a productive focused session alive.
Lets do something a bit more interesting:
Consider this case now. We have our list of PM’s and each PM is managing a number of customers. We want to indicate the top customer per PM.
Below I have a matrix with PMs as the rows, customer as the columns, and “Job Value” as the cell value. In the matrix to the right I want to show the name of the top customer for each PM.

Step 1: SUMMARIZE
Lets try and visualize how we can solve this.
Firstly, for each PM we need to calculate the values for each Customer. Lets think of how this could work in each row of our “TOP CUSTOMER BY PM visual. For each row, our PM will be filtered from our Jobs table, so the step is to group each customer and sum its total value. In DAX this can be done with the SUMMARIZE function.
To test I am going to create a DAX table and filter the results to one PM, Andris Ekkel. This function looks like this.
Test Table = SUMMARIZE(FILTER(Jobs,Jobs[projectManager_ID] = "146"),Jobs[customer_ID],"Sum",Sum(Jobs[Value]))
We can place the data from this Test Table in to a matrix and see that the numbers by Andris’s customers match our initial matrix and our new SUMMARIZE table.


Step 2: TOPN
Next step is we want to reduce this slice of customer summaries to the top customer.
TOPN will do the trick!
All we have to do wrap our summarize in a TOPN, show the 1st, sorted by the sum.
Test Table = TOPN(1,SUMMARIZE(FILTER(Jobs,Jobs[projectManager_ID] = "146"),Jobs[customer_ID],"Sum",Sum(Jobs[Value])),[Sum],DESC)

Great! Now we have a function that gets the top customer for Andris. To extend this solution, we are going to start turning this into a measure that we can place on our visual.
Step 3: Creating our measure
Now we are going to start creating a new measure. Lets copy our TOPN statement, remove the PM filter, and then paste it into a new measure. We’ll start with a very naïve attempt.

All we did here, is assign our TOPN result to a variable and then try to return the result. But we get an error.
“The expression refers to multiple columns. Multiple columns cannot be converted to a scalar value.”
We can see the problem is that our TOPN statement is returning 2 columns, a variable result thus cannot be determined.
IF ONLY WE KNEW A FUNCTION THAT COULD SELECT A SINGLE COLUMN FROM A TABLE
Lets wrap our TOPN in a SELECTCOLUMNS only grabbing the resulting customer id.

Awesome! There are two last improvements we can make to this.
Its hard to see if this is actually correct now. Lets add a lookup to return the customer name!
TIES
I’m going to replace my return x with the following.
LOOKUPVALUE(Customers[customer],Customers[Index],x)

Great, its really easy to spot that our measure is doing what we want it to now.
Ties:
Next lets think conceptually the reason what we' have done works, is for each PM we have:
Summarized customers and REDUCED to 1 ROW (or 0)
Used SELECTCOLUMNS to REDUCE to 1 COLUMN (or 0)
-> Our measure will not let us assign the result of our statement to a variable if either of the above fail.
-> We’ve explicitly selected one column. So a case that this could break is if reducing to 1 row in the TOPN fails.
Unfortunately TOPN doesn’t really have a great way to handle this.
But here are a few ideas.
Add very small decimal values to your totals to act as tie breakers.
Use CONCATONATEX to join all the resulting customers into one text value. We can show all of them!
Call out the tie, and move on…
Here I’m going to implement the 3rd option, but you can reach out if you are curious about the first 2.

And we’re done!
One final footnote: Storage impact
I mentioned this earlier but here is some evidence: I said that the storage impact of DAX tables vs Power Query were identical. I’ve created a duplicate of our PM table in Power Query. See the two tables below.

DAX Table

Power Query table
Next, I’ve opened up DAX studio and connected to this model. The vertipaq analysis results are identical! Though, note the Power BI report does need to be closed and reopened for the DAX table results to compress properly.

Summary
SELECTCOLUMNS is a simple function, but it opens the door for us to visualize and take slow steps to solutions that could get messy.
I hope this example and walk through will help your efforts in the future as you grow in your Power BI skills.
Let’s Chat
At FreshBI, we’ve lowered the barriers, risk and cost of developing world-class Power BI dashboards so that you can unlock the value in your data.
Contact us through the scheduling app to start a conversation about how our data visualization consultants can design your best Power BI dashboards today.
Our Latest Blogs


About FreshBI
Operating throughout USA and Canada, FreshBI is a boutique Microsoft Partner using Power BI to unlock the value trapped in your data so that your business can succeed.