
In order to inspire DoorDash consumers to order from the platform there are few tools more powerful than a compelling image, which raises the questions: what is the best image to show each customer, and how can we build a model to determine that programmatically using each merchant’s available images?

Out of all the different information presented on the home page (see Figure 1), studies with consumers have repeatedly shown that images play the most important role in providing consumers with “evidence” that helps them choose a merchant and which items to order. When consumers evaluate an unfamiliar restaurant, they first think “Does it look good?” Essentially, people eat with their eyes and images can tell them a lot about the food’s cuisine, type of restaurant, quality of food, nutritional information, price range, and more. Once they determine that an item looks good, consumers will continue the ordering journey and access other factors such as type of food, wait time, affordability, etc.
Given the importance of merchant images shown in the studies, we decided to start the project to optimize the merchant image shown to consumers. We want to build a model that will choose the product images that will best entice and inspire consumers. We also wanted to build an exploration model to keep expanding our understanding of which images interest customers.
How we grew our image selection models
How we grew our image selection from an MVP to its current progress exemplifies our team's practice of starting small and then using data and testing to grow progressively. At the beginning, the image selection logic was simple. We showed the header image for a store in a carousel which is manually selected by operators at the store or business level and showed the image of the best-selling item of the store in store feed and search feed. With the setting, consumers only see a single image across various discovery surfaces. The selected image remained static as it represented the store’s best selling item which had minimal variance over time. In addition, there is a pitfall of the image selection logic, which is that the most bought item may not be an entree or terribly representative of a store. It's not uncommon for a popular side like fries or a soda to be featured instead of an entree that would better represent the merchant’s offerings.
How we progressed beyond the MVP
The MVP we built was a positive first step, but after collecting data about the product's shortcomings, our team went about making improvements for the next iteration. The personalization team first built an image filtration to filter out common items that might not be representative of the merchant. This was done by putting in business rules for restaurants that featured images, should not be drinks or sides (unless that was the merchant’s primary selling point), and saw improvement on key metrics such as conversion in the A/B test.
As the next step, we tested rotating discovery images from a pool of four images (one header image and three most-selling dishes), to showcase a wider selection of best selling items from the store menu. Figure 2 shows an example of an image pool of a merchant. The team hypothesized that showing fresher images will help consumers reconsider a merchant they had previously passed over. The goals were to:
- determine if image rotation improved consumer engagement (clicks);
- determine if image rotation encouraged consumers to try new merchants;
- determine whether the combination of the two above improved conversion rate; and
- collect training data for machine learning algorithms.

The test drove improvements in homepage clicks and new restaurant trials but had a negative impact on homepage conversions. What this means is that fresher images attracted more consumer interest and drove click-throughs to merchant pages. However, fresh images didn’t guarantee conversion. While rotated images piqued consumers' interest, consumers might be confused that previously rejected merchants showed up differently on their feeds, and opted to reject the same merchants again. The additional friction (rejecting the same merchant again) took away the time consumers could have used on exploring other merchants they are more likely to order from. Therefore the overall homepage conversion dropped. The lesson we learned from here is that there is a difference between what drives click and what drives conversion.
Selecting the best image for each merchant
To address the shortcoming of image rotation, we need to select an image which has high quality and can really drive conversion. Recall that the image pool consists of images from featured (top selling) items. Another challenge we had to deal with was that just because an item was a top seller did not mean it had a high-quality or compelling image. These low-quality images could potentially be bad representatives of the merchant’s selection and items and showing them on the discovery surfaces may actually hurt the conversion rate.
To solve the problem, we used a data driven approach to answer the question: if we need to choose one single image to represent a merchant, what would be the best image? Given that the team’s goal is to improve the conversion rate, it’s straightforward to look at past data to figure out which image drove most conversions. The image rotation experiment mentioned above provided us with the data we needed to start the image optimization process.
Balancing exploitation with exploration
Choosing the image which drove the most conversions in the image rotation experiment might be a good start. However, we cannot just choose the images from a previous one-time analysis. The following are the key problems that a simple approach runs into, and which we solved:
- New images don’t have a chance to be shown to consumers. The initial conversion rate is 0 for a new image but it may be an image with high quality.
- Consumers’ taste may change over time. The image which drove most conversion in the past is not guaranteed to drive most conversion in the future. If we always show the image, there is no chance for other images to catch up.
- Consumers may get tired of seeing the same image again and again. If the consumer doesn’t find the current image attractive, showing the same image may not help conversion.
To introduce exploration, we used a multi-arm bandit algorithm to implement the Image EnE model. The approach is similar to what we did in Homepage Recommendation with Exploitation and Exploration.
The composite (final) model score is formulated as:

where:
- c is the consumer id
- m is the merchant id
- i is the image url

where:
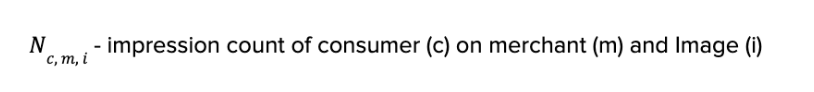
The exploitation score is the conversion rate (CVR score) for the image, aggregated over all consumers for each image. The exploration score is based on the number of impressions the consumer had on the image. The more impressions, the lower the score. The Image EnE model introduces uncertainty to the CVR score with a multiplier CENE to balance between exploitation and exploration.
We then select the image with the highest composite model score to display to the consumer. Both the exploitation term and exploration term contribute to the composite score. To explore an illustration of each contribution:
- For a given consumer, we explore until we find an image that converts. For example, the consumer saw image A on day one as it has the highest score on the day. The consumer had seen image A for several days but didn’t convert. Due to the impression discount, image B, with the second-best conversion rate, has a higher composite score than A on day three and has been surfaced to the consumer since then.
- Because we are always exploring, we learn when the global performance of images changes and do not lock into one image. Image A had the highest conversion rate on day one. However, the conversion rate dropped over time because consumers’ taste changed. Another image can have higher conversion rate and thus higher composite score than image A. The exploitation and exploration mechanism ensures fair competition among images and freshness of the images.
As a result, the explore-exploit model finds the most compelling image for a merchant from a pool of six images (five top selling items + header image) for every user session. Instead of exploiting one image, the model regularly surfaces a fresh image to consumers to explore and get feedback. As a consumer engages or does not engage with the merchant, the model learns their preferences and adjusts the image for the merchant. For instance,
- If a consumer does not convert on image A from a merchant, the model surfaces a different image B to gather feedback.
- If a consumer converts on image A from a merchant, the model then fixes the image with no future changes for this merchant-consumer pair to ensure recognizability.
- As the model collects feedback from all consumers, the “exploit” component of the model scales the highest conversion image (say image C) to all consumers.
Subscribe for weekly updates
Choosing the right tradeoff between exploitation and exploration
The multiplier CENE in the above formula controls the tradeoff between exploitation and exploration. To have a good product experience, we have to choose the multiplier appropriately. We can do an A/B test to determine the optimal value of the multiplier. However, A/B experiments take time and we need to ensure enough traffic for each treatment group. Therefore we cannot have too many treatment groups and multipliers to test. We have to narrow down our search space for the multipliers.
Before the A/B test, we analyzed the past data from the Image Rotation experiment. In the past data, we know the CVR score for each image. Therefore, for each merchant, we can simulate the image replacement process–that is, after how many impressions would the composite score be discounted enough such that the previously second-best image becomes the best. Aggregating over all merchants, we have the probability of image change after X views with different multipliers. We wrote code to run the analysis on past data so we can estimate the probability with as many multipliers as we want.
When the uncertainty multiplier is 0, there is no uncertainty and exploration, so the probability of image change is 0 regardless of the number of views. When the uncertainty multiplier is very high such as 0.05, there is more weight on the exploration term, making image change frequently; merchants would change images after 3 views when the multiplier is 0.05. Based on the data, we decided to test two variants in the first A/B test, one with multiplier=0 and the other with multiplier=0.01. We ran the A/B test for several weeks and saw improvement on new restaurant trials while maintaining conversion rate and order frequency.
Figure 3 shows examples where the model improved the image quality:

Contextualizing the image with the search query
The above paragraphs describe how we select an image for each merchant without any context such as consumer intent, time of day, and so on. We believe selecting an image that matches the current context is also important. To begin with, we started with the search query. When a consumer searches for a dish, there is a strong intent to order that dish. On average, these queries underperform merchant name searches in conversion.
We hypothesized that this may be happening due to friction in finding the dishes consumers are craving in that moment:
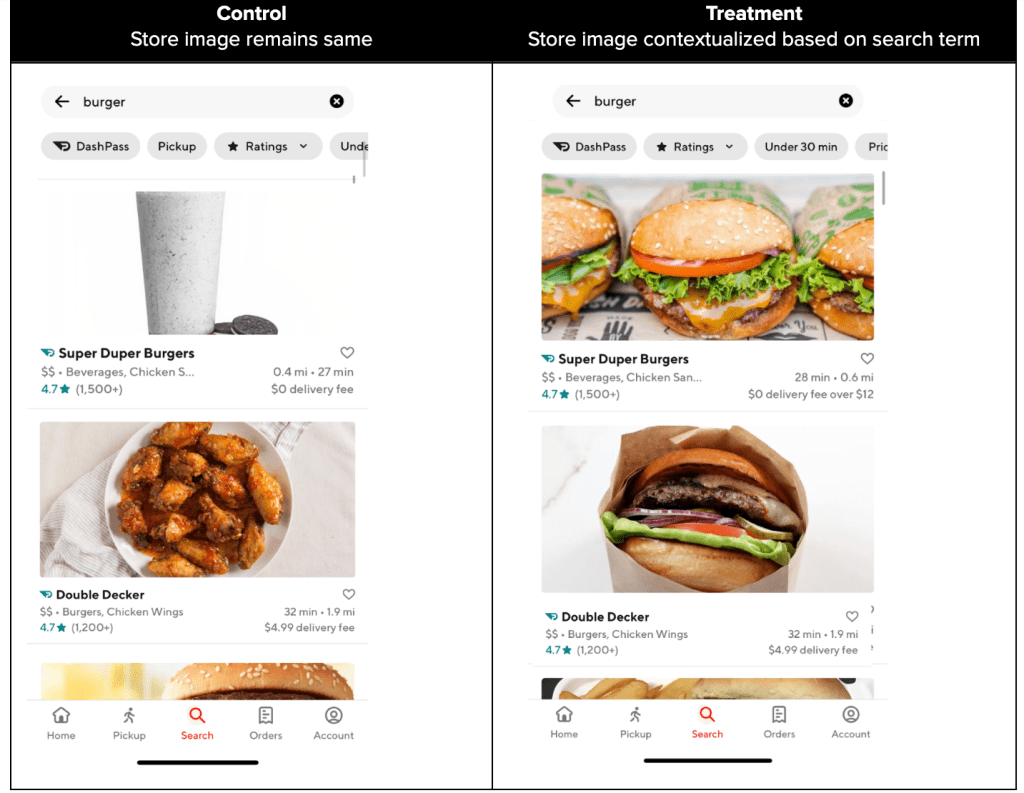
- When consumers search for a specific dish (e.g. burger), images of other dishes are surfaced on the search feed, necessitating a click through to the store to see if the merchant serves that dish.
- Even after landing on the store page, consumers have to scroll to find the dish.
Therefore, Search and Personalization teams tested:
- Surfacing contextualized images on the search feed that includes the best selling item related to what a consumer has searched with a goal to pique their interest and improve the click-through at the very first glance, especially for an unfamiliar store (Figure 4).
- Showing a carousel on top of the store page featuring items related to what the customer has searched for with an objective of reducing the friction of scrolling through the entire menu and improving conversion (Figure 5).
To power this feature we matched against item tags provided by the food catalog. We tested the feature together as: (1) we wanted to test the end state and we posited that both features together would have a higher volume impact (the image optimization would improve search CTR while the carousel would improve conversion), and (2) we had limited traffic to test against (7 search terms) - we would index on funnel metrics to help inform if both parts of the experience were successful.
User Experience

The A/B test showed a neutral impact on search conversion, probably because we were limited to the seven search terms (dish types) where the food catalog had high precision and recall. We will continue to improve the precision and recall of the food catalog, expand to more dish types, and iterate the product.
Future work
Our journey on Image Personalization doesn’t end here. There are many aspects where we can improve our system and algorithms. Below we describe some ideas for the next phases in the future.
- Rule-based, more contextual/consumer feature: similar to what we did for search context, we can start with a rule-based approach to boost images which fit other contexts or filter out images which don't fit the contexts.
- ML-based Image Personalization: we will go beyond a rule-based boost or filter and use machine learning to predict a score from the features. We will use historical data to train the model to predict a score based on more features. The score will be used as the exploitation score in the Image EnE framework described in the article, replacing the status quo which is conversion rate among all consumers.
- Content Personalization: Once we prove the success of image personalization, we will expand our expertise and experience from Image Personalization to other content on the discovery surfaces.
Conclusion
In the article, we explained the discovery surfaces on DoorDash, why having a good image on these discovery surfaces is important, and the goal of Image Personalization. Then we described how we start Image Personalization with Image Rotation to collect data and early signals. Next, we talked about why we need a balance between exploitation and exploration for images and how we achieve it. We introduced the reinforcement learning algorithm UCB and described how we use UCB in the Image Exploitation and Exploration (EnE) model. We also explained how we selected the multiplier to tradeoff exploitation and exploration and how we conducted A/B tests. We also introduced the concept of selecting images based on the context and described the experiment we did for search context. Finally, we talked about the future work of Image Personalization.
Acknowledgments
Many thanks to Parul Khurana, Josh Zhu, Yu Zhang, Mengjiao Zhang, Jay Zhang, Chen Dong, Di Li, and Sandor Nyako for sharing their insights on the development, and support for the execution of the ideas in this blog post. Our gratitude also goes to Elena Lin and Jessica Zhang for the data-driven insights and for helping us develop the experiment strategy and measurement framework. Special thanks Ezra Berger for the continuous support, review, and editing of this article.


