Product demo.
  What is data observability?
  What is a data mesh--and how not to mesh it up
  The ULTIMATE Guide To Data Lineage
 Just Launched: Data Products

Michael Segner
Michael writes about data engineering, data quality, and data teams.
At what level does it make sense to deploy your data monitoring coverage? For most traditional data quality tools the answer has been by table.
The typical workflow includes scanning or profiling a table, and then applying a number of suggested checks or rules. One by one by one by…

That’s awfully tedious for any environment with thousands, hundreds, or even just dozens of tables. Data teams are onboarding datasets quickly and with the power of modern platforms, that process has only been getting faster and volumes only getting larger.
That process can also lead to some pretty spotty coverage. Pipelines are constantly changing as new tables are added by multiple people across multiple teams. The chances that every team is going to be diligent in applying monitoring in a standard process is exceedingly low.
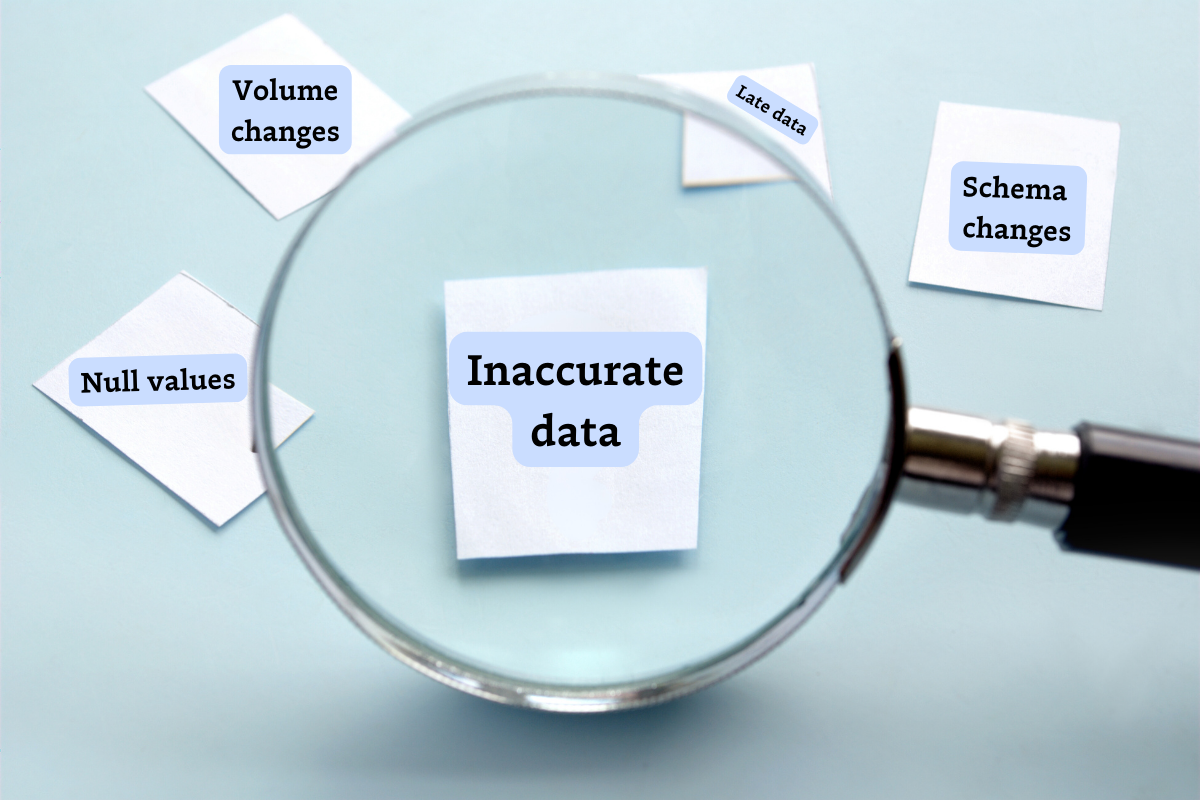
The other challenge is that bad data can come from any point in the pipeline: raw, staging, serving. It can come from your data sources, transformation code, or ELT systems. So if your data teams are sprinkling monitoring whimsically across a pipeline, you will have more problems than answers. More blindspots than a security camera in a heist movie.

On the other hand, we know not every table is created equal and that ad-hoc report you “whipped up real quick” for Bob in marketing 3 years ago probably doesn’t need the same level of attention as those feeding your ML models.
After working with hundreds of customers and monitoring millions of tables, we can confidently say a much better approach to deploy monitoring is automatically on a schema by schema or dataset by dataset basis.
Table of Contents
Introducing Data Products
With Data Products, Monte Carlo users can be confident they are monitoring everything that matters. Users simply select the dashboard or table that matters to them and Monte Carlo automatically tags and groups everything that is upstream of those assets that are connected via Lineage. You can also add in non-lineage-connected assets that you consider part of your Data Product definition if you choose.
Lets say your finance team has an important report with robust requirements for data quality. To ensure that report had the appropriate monitoring coverage, you would create a Data Product in Monte Carlo with that report at its core. Monte Carlo would automatically ensure that all upstream tables of that report were monitored with our automatic detectors and provide options to create more specific monitors as needed.
Drill Into What Matters
The benefits of Data Products go beyond monitoring. Now that those tables are tagged, logically grouped and monitored, data teams can better tailor their data reliability efforts to how their team delivers value. In other words, users can easily drill into what they care about.
For example, Audiences can be created and notifications on specific data products can be sent to specific teams. Perhaps those teams have tighter incident response SLAs and on-call rotation for more important data products.
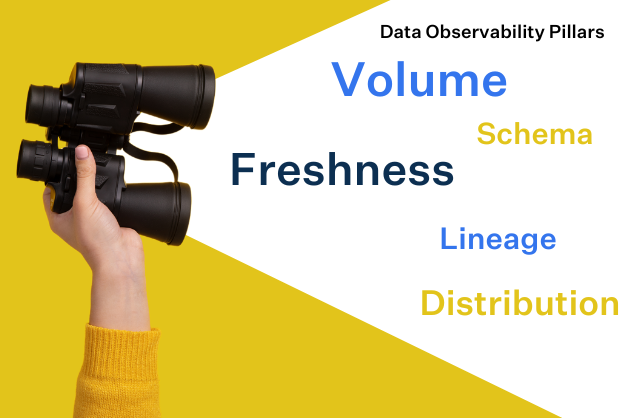
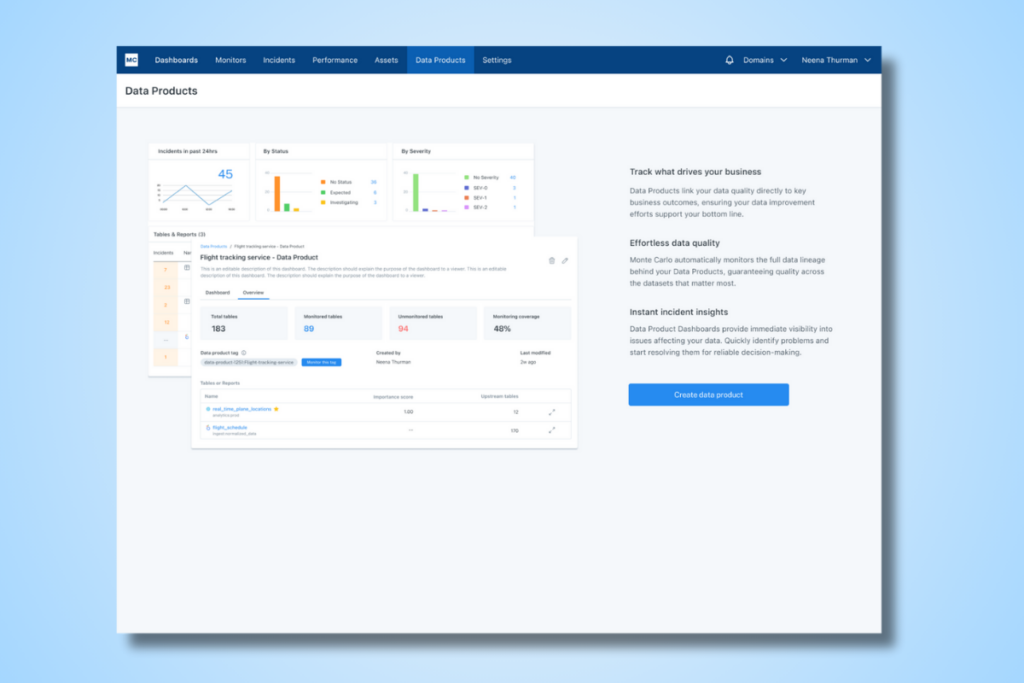
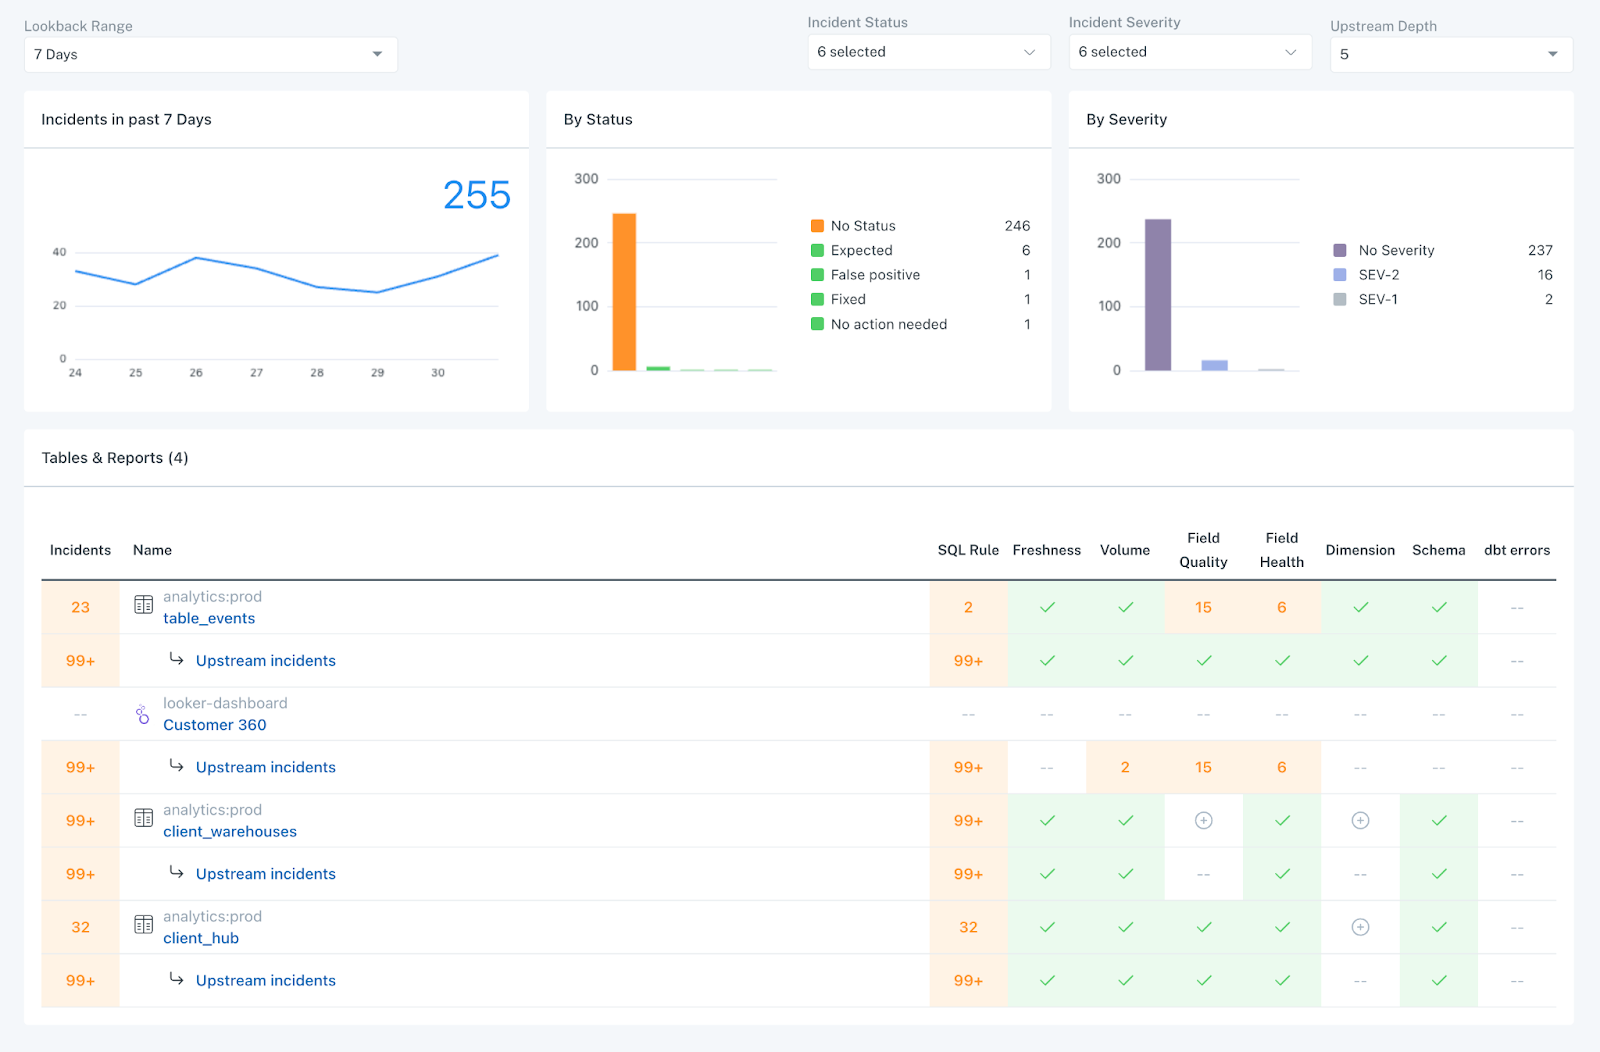
Speaking of SLAs…Monte Carlo also automatically generates an insightful Dashboard for each of your Data Products. This Dashboard tracks total incidents (with breakdowns by status and severity), pinpoints upstream incident locations, and monitors crucial metrics like data freshness, volume, incident status updates, response time, and time-to-fix. This provides a comprehensive health assessment for your Data Product.
This is important because, it turns out, the table level is not often the best altitude for measuring reliability levels either. Don’t get me wrong. You need to have insight into table health as well as visibility into organization-wide trends.
But when it comes down to it, your data consumers and your delivery team really want to know, is this data product operating as intended? If the entire dataset is critical to your business outcomes, then you should be measuring the health of the entire dataset. No table is an island.
The Roadmap
Data Products is currently in limited release with select customers and scheduled for wider roll-out this quarter. In the future, you can anticipate that we are going to find all sorts of interesting ways for teams to leverage the power of Data Product tags, from automating severity levels to notifications and more.
Want to learn more about Data Products and data observability? Speak to our team.
Our promise: we will show you the product.
Read more posts.