Product demo.
  What is data observability?
  What is a data mesh--and how not to mesh it up
  The ULTIMATE Guide To Data Lineage
 10 Ways to Optimize Your Data Observability ROI: Top Tips and Tricks from the Experts

Katie Noonan
Katie is a Support Engineering Leader at Monte Carlo.
Over the last five years, data observability has leveled up from industry buzzword to a must-have element of every data stack. Inspired by the practices of DevOps observability, data observability uses automated monitoring, alerting, and triaging — along with end-to-end lineage — to give organizations the ability to fully understand their data health.
With data observability, teams can identify and proactively resolve incidents of data downtime — moments when data is partial, erroneous, missing, or otherwise inaccurate. First, observability’s monitoring and alerting helps reduce teams’ time-to-detection when data quality issues inevitably arise. Then, thanks to improved visibility into downstream and upstream impacts, observability helps teams troubleshoot and fix broken pipelines faster, speeding up time-to-resolution.
The outcome? Better data quality, more reliable insights, and greater organizational trust—all in less time and with fewer resources. Win, win, win, win, win.
Hundreds of organizations across dozens of industries have improved their data quality by using Monte Carlo’s data observability platform. Along the way, we’ve worked with their teams to fine-tune the best practices they’d need to implement to scale data observability across the organization.
And today, we’ve compiled a few of our favorite best practices to share with the world—compliments of our data reliability pioneers. These leading experts have firsthand experience leveling up with observability — from early implementation to unlocking advanced features and incredibly valuable benefits.
No matter your starting point, these pro tips and real-life examples will help you power up your data observability and advance to the next level.
Table of Contents
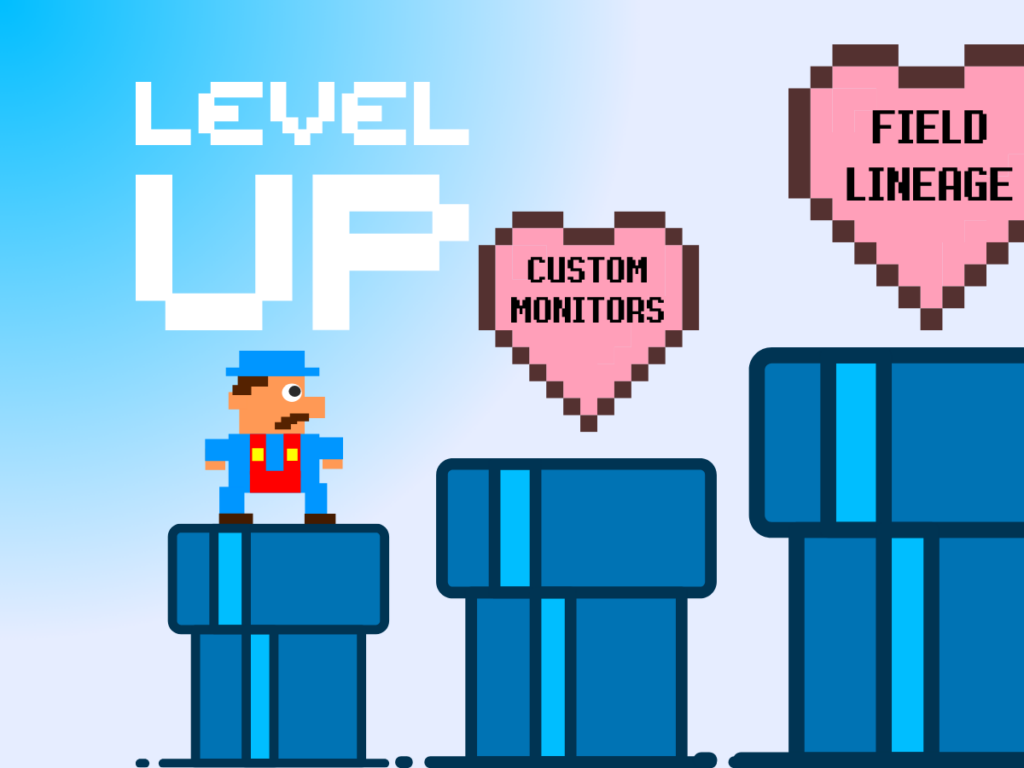
Level one: Get your pipelines in order
At the early stages of your data observability journey, you have a lot of learning to do. You’re probably struggling to make business decisions with bad data or dealing with delayed or incorrect data causing a mess for downstream consumers.
At this stage, your goal is pretty simple: understand how your data pipelines are operating today.
Luckily, Monte Carlo makes it easy to start collecting wins from day one with automated monitors and easy-to-use dashboards.
Tip #1: Don’t be afraid to start small with data observability
Our experts’ number one tip for getting started with data observability? Don’t get too complicated.
“When somebody comes in and wants to start with a complex project, I encourage them to get into the tool, see the UI, and use the out-of-the-box features first,” says Jessica Cook, Staff Data Analyst at digital marketing solution Sojern. “There’s so much power right there. You don’t have to do anything complicated. There is nothing wrong with starting simple and building.”
Daniel Mas Buitrago, Senior Analytics Engineer at Tools for Humanity, agrees. “Before we started with Monte Carlo, we didn’t have anything related to data observability implemented. The progress that we made on the first day, just using these simple automatic monitors, was great. We started getting insights super quickly, without spending any time setting up anything.”
Tip #2: Leverage schema change monitors
For Daniel’s team, Monte Carlo’s automated schema change monitors provided immediate value.
“Schema change monitors are critical because we aren’t always informed by the engineering team about schema changes in the source database,” Daniel says. “Thanks to Monte Carlo, we can detect these issues very quickly — most of the time, even before our data workflow fails, so users aren’t impacted. And the best thing is that these monitors are automatic, so we don’t have to spend time setting them up.”
Tip #3: Lean into out-of-the-box freshness and volume monitors
Jessica has been using Monte Carlo for two years — but reports that her team at Sojern continually sees a lot of value from automated monitors, especially those that track freshness and visibility.
“Monte Carlo sits on top of all of our jobs that are running,” says Jessica. “Freshness and volume monitors allow us as an engineering team to proactively see everything in one space — and, with a very easy and simple UI, to take action quickly when there’s a job that’s failing.”
The out-of-the-box monitors work quickly, identifying changes in historical patterns, like when a table that’s supposed to be growing suddenly stops. “When the job is running but a table is not picking up new data, that’s an indication that an upstream job has failed,” Jessica says. “And that wouldn’t really be visible outside of Monte Carlo.”
Then, her engineering team can pinpoint when an important table needs attention — and loop in any operations teams who rely on downstream reports, minimizing the negative impacts of data downtime.
Tip #4: Monitor the performance of your SQL queries
In addition to automated monitors, Monte Carlo has a Performance tab that essentially aggregates all of the queries running in an environment, including dbt load jobs. This dashboard includes information like how many queries are running over a given time period, their max runtime, and their average runtime — information teams can use to identify, for example, when a dbt job is taking five times the amount of runtime it typically should.
For Jessica, the Performance dashboard helps her team identify when their database is maxing out on capacity. “We use BigQuery, and sometimes it just happens that a user will inadvertently set off a job that they don’t realize is really heavy on the database,” she says. “Or you have a lot of users hitting the database at the same time. When you’re in a system that has slot capacity, these incidents can take up all the slots, and then you wonder why everything’s stuck. Monte Carlo has been really helpful by sitting on top of our BigQuery instance and showing us who exactly is running which query — so we can tell them to go turn it off in a very timely manner.”
Georvic Tur, Senior Data Engineer at Tools for Humanity, uses Performance dashboards to make sure his team’s real-time data ingestions are running correctly. “For us, the Performance tab is a way of checking if, for example, the CDC tools like AWS DMS or AirByte are delivering on-time data.”
And Daniel describes Performance as his “best friend” in supporting a big project to remove dependencies on Redshift schemas from their BI tool. “I can see very easily how many queries have been executed, the details of the queries, which dashboards are sending them, which BI user is running them — it’s saving me hours and hours of work right now.”
Level two: Dive deeper into data observability business use cases
After driving value from out-of-the-box monitors and dashboards, you might be ready to address specific business use cases through advanced monitoring.
Maybe it’s time to add in external integrations to improve coverage, facilitate faster triaging, and speed up root cause analysis. Or maybe, you’re expanding to multiple data teams and need to operationalize actionable alerts.
At this stage, our data observability pioneers recommend leveling up with more specialized functionality.
Tip #5: Filter data by domains
Now that your out-of-the-box monitors have trained themselves by learning your historical patterns, Monte Carlo’s Domains and Dashboards features can give you a summarization of how your pipeline is tackling performance as a whole.
Jessica recommends setting up domains according to how data ownership is distributed within your organization. “We have one team that’s really into data ingestion, one team that’s doing account setup in our Salesforce CRM, and a data warehouse team that’s monitoring our stable data in BigQuery, feeding reporting,” she says. “Each of those teams are going to look at different tables. You set up a domain for the tables that each of those teams should track, and the dashboard helps you see how many tables they’re tracking, how many incidents are being triggered, what the potential issues are, how many views, et cetera.”
This allows data leaders to understand how different teams are responding when issues occur by evaluating how quickly they respond to, resolve, and close out data incident alerts.
Tip #6: Track table and data product health with dashboards
Monte Carlo’s dashboards make it possible to zero in on the health of the specific tables and data products that are most valuable to your organization.
“We take a particularly close eye on client reporting,” Jessica says. “Anything client reporting, we want to make sure is really high quality — the dashboard allows us a very easy way to see that across the company.”
Tip #7: Align closely with your business stakeholders
Setting up data domains and dashboards shouldn’t happen in isolation — you’ll want to consult with your key business stakeholders to ensure you’re driving the most value from these features.
“When we implemented Monte Carlo, the tool was purchased for our engineering department,” says Jessica. “But I specifically went to our operations team and got them on the tool, set them up to receive Slack notifications, and asked which tables they used most in their reporting. We set them up with an operations domain, and it is 50 of the most important tables in our company. That domain is the most widely watched across multiple engineering teams, and we action incidents on those 50 core data assets as the most critical for our company.”
Tip #8: Level up with SQL rules, dimension tracking, and other advanced data quality monitors
In addition to automated monitors like freshness, volume, and schema changes, our data observability experts recommend using more advanced monitors that allow you to hone in on particular business use cases.
For instance, Georvic’s team uses SQL rules to define custom anomaly detectors that run on set frequencies. They also use custom monitors in Redshift to keep track of long-running transactions that relate to the functioning of their data warehouse.
And Jessica’s team at Sojern uses advanced monitors to track specific instances of data ingestion that are especially prone to error. “We integrate with thousands of external sources — you can imagine the amount of human error potential to come in and cause havoc,” she says. “One thing that happens all the time is around currencies and currency conversion, where a missing decimal point turns a file from $20 to $2000. We’ve had clients send us $20 million — as a file error. Monte Carlo helps us identify those, backtrack into what happened, and then fix the error. Or, for instance, we can use a percentage null tracker on a table that’s used for reporting to identify data sources with missing IDs that are needed for clean reporting.”
Level three: Dive deeper into your pipelines to understand your total data environment
Once you’ve reached the final boss stage of data observability, your teams might be ready to expand programmatically into various pipelines. Maybe you want to integrate things like circuit breakers, your own API workflows, or your code base. Maybe you’re ready to focus more on prevention than reactive fixing. Whatever your situation, your goals will be larger and more tailored to the business value your team has been tasked to execute on.
This is when integrations deeper into your own data pipelines, like dbt and Tableau, become especially important.
Tip #9: Use end-to-end field-level lineage to understand root cause and impact
When Monte Carlo is implemented and integrated across your entire stack, data observability delivers end-to-end field-level lineage, which offers a granular understanding of how your data flows throughout every stage of its lifecycle, from ingestion to consumption. That means root cause analysis becomes easier and more precise, and your team gets even more visibility into potential problem areas that need to be addressed.
“One feature that dbt provides is the ability to use lineage to see the dependencies between models, but for us, that’s not enough,” says Georvic. “What we found after integrating dbt with Monte Carlo is that we can overlay incident information with the lineage that dbt already provides. In addition, Monte Carlo augments that lineage with the other sources that dbt doesn’t have access to. That’s extremely valuable to very easily see which incidents are related, and what may have caused them. This is especially true after filtering by time, so that the appropriate incidents appear on the overlaid lineage.”
Tip #10: Rich integrations with the modern data stack detect quality issues across your data environment
When Monte Carlo integrates with BI tools, data teams instantly improve their ability to guard against quality issues within highly visible, highly impactful reports and products.
For example, Jessica describes how her team integrated Monte Carlo and Tableau. “We’ve added Tableau under Monte Carlo, and that fills out the lineage of a table in BigQuery, that’s run through a job, and generates these five dashboards in Tableau. And maybe that table only has one thing that lives in Tableau, but it’s a report that’s consumed by thousands of clients. We automatically bump up that priority in Monte Carlo to say ‘Hey, this thing is important. We need to star it as a key asset and really watch it carefully to make sure that data quality remains consistent and good.’”
Pioneering the future of reliable data with observability
Data pros like Jessica, Daniel, and Georvic are at the forefront of data observability practice — using Monte Carlo to operationalize everything from monitoring core data assets to ensuring reliability across LLM pipelines. And with their best practices in your pocket, you can use Monte Carlo to get up to speed and start driving value even faster.
Thanks to our Reliability Pioneers who are helping us pave the way toward more trustworthy data. To learn how data observability can help level up your data quality game, get in touch with our team today.
Our promise: we will show you the product.
Read more posts.