Product demo.
  What is data observability?
  What is a data mesh--and how not to mesh it up
  The ULTIMATE Guide To Data Lineage
 [O’Reilly Book] Chapter 1: Why Data Quality Deserves Attention Now

Molly Vorwerck
Molly is Head of Content & Communications @ Monte Carlo.
Raise your hand (or spit out your coffee, sigh deeply, and shake your head) if this scenario rings a bell.
Data is a priority for your CEO, as it often is for digital-first companies, and she is fluent in the latest and greatest business intelligence tools. Your CTO is excited about migrating to the cloud, and constantly sends your team articles highlighting performance measurements against some of the latest technologies. Your downstream data consumers including product analysts, marketing leaders, and sales teams rely on data-driven tools like CRMs, CXPs, CMSs, and any other acronym under the sun to do their jobs quickly and effectively.
As the data analyst or engineer responsible for managing this data and making it usable, accessible, and trustworthy, rarely a day goes by without having to field some request from your stakeholders. But what happens when the data is wrong?
Have you ever been about to sign off after a long day running queries or building data pipelines only to get pinged by your Head of Marketing that “the data is missing” from a critical report? What about a frantic email from your CTO about “duplicate data” in a business intelligence dashboard? Or a memo from your CEO, the same one who is so bullish on data, about a confusing or inaccurate number in his latest board deck?
If any of these situations hit home for you, you’re not alone.
This problem, often referred to as “data downtime,” happens to even the most innovative and data-first companies, and, in our opinion, it’s one of the biggest challenges facing businesses in the 21st century. Data downtime refers to periods of time where data is missing, inaccurate, or otherwise erroneous, and it manifests in stale dashboards, inaccurate reports, and even poor decision making.
The root of data downtime? Unreliable data, and lots of it.
Data downtime can cost companies upwards of millions of dollars per year, not to mention customer trust. In fact, ZoomInfo found in 2019 that 1 in 5 companies lost a customer due to a data quality issue.
As you’re likely aware, your company’s bottomline isn’t the only thing that’s suffering from data downtime. Handling data quality issues consumes upwards of 40 percent of your data team’s time that could otherwise be spent working on more interesting projects or actually innovating for the business.
This statistic probably comes as no surprise. It certainly didn’t to us.
In a former life, Barr Moses, served as VP of Operations at a customer success software company. Her team was responsible for managing reporting for the broader business, from generating dashboards for her CEO to use during All Hands meetings to setting strategy to reduce customer churn based on user metrics. She was responsible for managing her company’s data operations and making sure stakeholders were set up for success when working with data.
Barr will never forget the day she came back to her desk from a grueling, hours-long planning session to find a sticky note with the words “The data is wrong” on her computer monitor. Not only was this revelation embarrassing, but unfortunately, it wasn’t uncommon. Time and again her and her team would encounter these silent and small, but potentially detrimental, issues with their data.
There had to be a better way.
Poor data quality and unreliable data have been problems for organizations for decades, whether it’s caused by poor reporting, false information, or technical errors. And as organizations increasingly leverage data and build more and more complex data ecosystems and infrastructure, this problem is only slated to increase.
The concept of “bad data” and poor data quality has been around nearly as long as humans have existed, albeit in different forms. With Captain Robert Falcon Scott and other early Antarctic explorers, poor data quality (or rather, data-uninformed decision making) led them to inaccurately forecast where and how long it would take to get to the South Pole, their target destination.
There are several in more recent memory that stick out, too. Take the infamous Mars Climate Orbiter crash in 1999. A NASA space probe, the Mars Climate Orbiter crashed as a result of a data entry error that produced outputs in non-SI (International System) units versus SI units, bringing it too close to the planet. This crash cost NASA a whopping $125 million dollars. Like spacecraft, analytic pipelines can be extremely vulnerable to the most innocent changes at any stage of the process.
And this just scratches the surface.
Barr’s unfortunate sticky note incident got her thinking: “I can’t be alone!”
Alongside Lior Gavish, Barr set out to get to the root cause of the “data downtime” issue. Together, they interviewed hundreds of data teams about their biggest problems, and time and again, data quality sprang to the top of the list. From e-commerce to healthcare, companies across industries were facing similar problems: schema changes were causing data pipelines to break, row or column duplicates were surfacing on business critical reports, and data would go missing in dashboards, causing them significant time, money, and resources to fix. We also realized that there needed to be a better way to communicate and address data quality issues as part of an iterative cycle of improving data reliability — and building a culture around driving data trust.
These conversations inspired us to write this book to convey some of the best practices we’ve learned and developed related to managing data quality at each stage of the data pipeline, from ingestion to analytics, and share how data teams in similar situations may be able to prevent their own data downtime.
For the purpose of this book, “data in production” refers to data from source systems (like CRMs, CSMs, and databases from any of the other analogies previously mentioned) that has been ingested by your warehouse, data lake, or other data storage and processing solutions and flows through your data pipeline (ETL) and surfaced by the analytics layer to business users. Data pipelines can handle both batch and streaming data, and at a high-level, the methods for measuring data quality for either type of asset are much the same.
Data downtime draws corollaries to software engineering and developer operations, a world in which application uptime or downtime (meaning, how frequently your software or service was “available” or “up”, or “unavailable” or “down”) is measured scrutinously to ensure that software is accessible and performant. Many site reliability engineers use “uptime” as a measurement because it correlates directly to the customer impact of poor software performance on the business. In a world where “five nines” (in other words, 99.999% uptime) of reliability is becoming the industry standard, how can we apply this to data?
In this book, we will address how modern data teams can build more resilient technologies, teams, and processes to ensure high data quality and reliability across their organizations.
In Chapter 1, we’ll start by defining what data quality means in the context of this book. Next, we’ll frame the current moment to better understand why data quality is more important for data leaders than ever before. And finally, we’ll take a closer look at how best-in-class teams can achieve high data quality at each stage of the data pipeline and what it takes to maintain data trust at scale. This book focuses primarily on data quality as a function of powering data analytical data pipelines for building decision making dashboards, data products, ML models, and other data science outputs.
What is Data Quality?
Data quality as a concept is not novel – “data quality” has been around as long as humans have been collecting data!
Over the past few decades, however, the definition of data quality has started to crystallize as a function of measuring the reliability, completeness, and accuracy of data as it relates to the state of what is being reported on. As they say, you can’t manage what you don’t measure, and high data quality is the first stage of any robust analytics program. Data quality is also an extremely powerful way to understand whether your data fits the needs of your business.
For the purpose of this book, we define data quality as the health of data at any stage in its life cycle. Data quality can be impacted at any stage of the data pipeline, before ingestion, in production, or even during analysis.
In our opinion, data quality frequently gets a bad rep. Data teams know they need to prioritize it, but it doesn’t roll off the tongue the same way “machine learning,” “data science,” or even “analytics” does, and many teams don’t have the bandwidth or resources to bring on someone full-time to manage it. Instead, resource-strapped companies rely on the data analysts and engineers themselves to manage it, diverting them away from projects that are conceived to be more interesting or innovative.
But if you can’t trust the data and the data products it powers, then how can data users trust your team to deliver value? The phrase, “no data is better than bad data” is one that gets thrown around a lot by professionals in the space, and while it certainly holds merit, this often isn’t a reality.
Data quality issues (or, data downtime) are practically unavoidable given the rate of growth and data consumption of most companies. But by understanding how we define data quality, it becomes much easier to measure and prevent it from causing issues downstream.
Framing the Current Moment
Technical teams have been tracking — and seeking to improve — data quality for as long as they’ve been tracking analytical data, but only in the 2020s has data quality become a top-line priority for many businesses. As data becomes not just an output but a financial commodity for many organizations, it’s important that this information can be trusted.
As a result, companies are increasingly treating their data like code, applying frameworks and paradigms long-standard among software engineering teams to their data organizations and architectures. Developer Operations (DevOps), a technical field dedicated to shortening the systems development life cycle, spawned industry-leading best practices such as Site Reliability Engineering (SRE), CI/CD (continuous integration / continuous deployment), and microservices-based architectures. In short, the goal of DevOps is to release more reliable and performant software through automation.
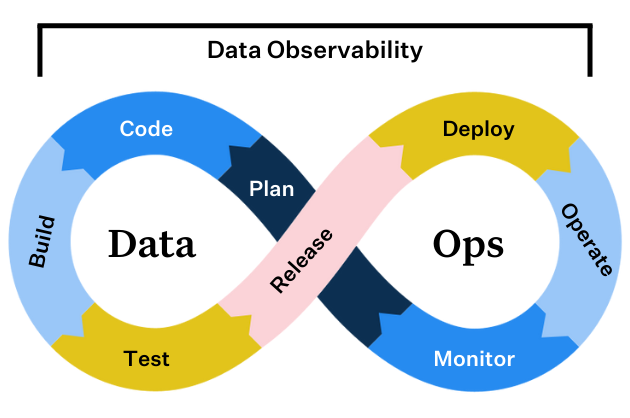
Over the past few years, more and more companies have been applying these concepts to data in the form of “DataOps.” DataOps refers to the process of improving the reliability and performance of your data through automation, reducing data silos and fostering quicker, more fault-tolerant analytics.
Since 2019, companies such as Intuit, Airbnb, Uber, and Netflix have written prolifically about their commitment to ensuring reliable, highly available data for stakeholders across the business by applying DataOps best practices. In addition to powering analytics-based decision-making (i.e., product strategy, financial models, growth marketing, etc.), data produced by these companies powers their applications and digital services. Inaccurate, missing, or erroneous data can cost them time, money, and the trust of their customers.
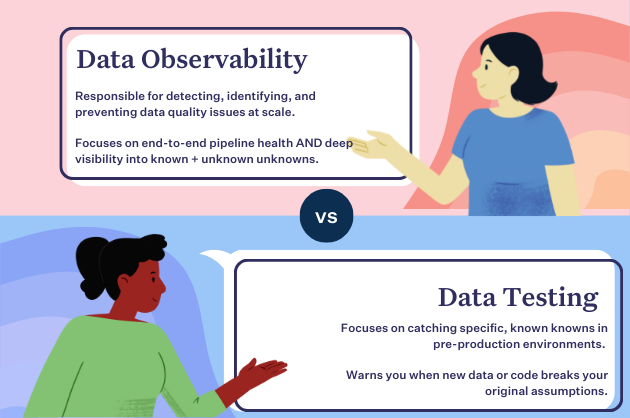
As these tech behemoths increasingly shed light on the importance and challenges of achieving high data quality, other companies of all sizes and industries are starting to take note and replicate these efforts, from implementing more robust testing to investing in DataOps best practices like monitoring and data observability.
But what has led to this need for higher data quality? What about the data landscape has changed to facilitate the rise of DataOps, and as such the rise of data quality? We’ll dig into these questions next.
Understanding the “rise of data downtime”
With a greater focus on monetizing data coupled with the ever present desire to increase data accuracy, we need to better understand some of the factors that can lead to data downtime. We’ll take a closer look at variables that can impact your data next.
Migration to the cloud
Twenty years ago, your data warehouse (a place to transform and store structured data) probably would have lived in an office basement, not on AWS or Azure. Now, with the rise of data-driven analytics, cross-functional data teams, and most importantly, the cloud, cloud data warehousing solutions such as Amazon Redshift, Snowflake, and Google BigQuery have become increasingly popular options for companies bullish on data. In many ways, the cloud makes data easier to manage, more accessible to a wider variety of users, and far faster to process.
Not long after data warehouses moved to the cloud, so too did data lakes (a place to transform and store unstructured data), giving data teams even greater flexibility when it comes to managing their data assets. As companies and their data moved to the cloud, analytics-based decision making (and the need for high quality data) became a greater priority for businesses.
More data sources
Nowadays, companies use anywhere from dozens to hundreds of internal and external data sources to produce analytics and ML models. Any one of these sources can change in unexpected ways and without notice, compromising the data the company uses to make decisions.
For example, an engineering team might make a change to the company’s website, thereby modifying the output of a data set that is key to marketing analytics. As a result, key marketing metrics may be wrong, leading the company to make poor decisions about ad campaigns, sales targets, and other important, revenue-driving projects.
Increasingly complex data pipelines
Data pipelines have become increasingly complex with multiple stages of processing and non-trivial dependencies between various data assets as a result of more advanced (and disparate) tooling, more data sources, and increasing diligence afforded to data by executive leadership. Without visibility into these dependencies, however, any change made to one data set can have unintended consequences impacting the correctness of dependent data assets.
In short, there’s a lot that goes on in a data pipeline. Source data is extracted, ingested, transformed, loaded, stored, processed, and delivered, among other possible steps, with many APIs and integrations between different stages of the pipeline. At each juncture, there’s an opportunity for data downtime, just like there’s an opportunity for application downtime whenever code is merged. Additionally, things can go wrong even when data isn’t at a critical juncture, for instance, when data is migrated between warehouses or manually entered in a source system.
More specialized data teams
As companies increasingly rely on data to drive smart decision making, they are hiring more and more data analysts, data scientists, and data engineers to build and maintain the data pipelines, analytics, and ML models that power their services and products, as well as their business operations.
While data analysts are primarily responsible for gathering, cleaning, and querying data sets to help functional stakeholders produce rich, actionable insights about the business, data engineers are responsible for ensuring that the underlying technologies and systems powering these analytics are performant, fast, and reliable. In industry, data scientists typically collect, wrangle, augment, and make sense of unstructured data to improve the business. The distinction between data analysts and data scientists can be a little vague, and titles and responsibilities often vary depending on the needs of the company. For instance, in the late 2010s, Uber changed all data analysts’ titles to data scientists after an organizational restructure.
As data becomes more and more foundational to business, data teams will only grow. In fact, larger companies may support additional roles including data stewards, data governance leaders, operations analysts, and even analytics engineers (a hybrid data engineer-analyst role popular with startups and mid-sized companies who may not have the resources to support a large data team).
With all of these different users touching the data, miscommunication or insufficient coordination is inevitable, and will cause these complex systems to break as changes are made. For example, a new field added to a data table by one team may cause another team’s pipeline to fail, resulting in missing or partial data. Downstream, this bad data can lead to millions of dollars in lost revenue, erosion of customer trust, and even compliance risk.
Decentralized data teams
As data becomes central to business operations, more and more functional teams across the company have gotten involved in data management and analytics to streamline and speed up the insights gathering process. Consequently, more and more data teams are adopting a distributed, decentralized model that mimics the industry-wide migration from monolithic to microservice architectures that took the software engineering world by storm the mid-2010s.
What is a decentralized data architecture? Not to be confused with the data mesh, which is an organizational paradigm that leverages a distributed, domain-oriented design, a decentralized data architecture is managed by a central data platform team, with analytical and data science teams distributed across the business. Increasingly, we’re finding that more and more teams leaning into the embedded data analyst model are relying on this type of architecture.
For instance, your 200-person company may support a team of 3 data engineers and 10 data analysts, with analysts distributed across functional teams to better support the needs of the business. Either these analysts will report into operational teams or centralized data teams but own specific data sets and reporting functions. Multiple domains will generate and leverage data, leading to the inevitability that data sets used by multiple teams become duplicated, go missing, or go stale over time. If you’re reading this book, you’re probably no stranger to the experience of using a data set that’s no longer relevant, unbeknownst to you!
Other industry trends contributing to the current moment
In addition to the aforementioned factors that frequently lead to data downtime, there are also several industry shifts occurring as a result of technological innovation that are driving transformation of the data landscape. These shifts are all contributors to this heightened attention to data quality.
Data Mesh
Much in the same way that software engineering teams transitioned from monolithic applications to microservice architectures, the data mesh is, in many ways, the data platform version of microservices. It’s important to note that the concept of data mesh is nascent, and there is much discussion in the data community regarding how (or whether it makes sense) to execute on one at both a cultural and technical level.
As first defined by Zhamak Dehghani, a ThoughtWorks consultant and the original architect of the term, a data mesh, Figure 1-1, is a sociotechnical paradigm that recognizes the interactions between people and the technical architecture and solutions in complex organizations. The data mesh embraces the ubiquity of data in the enterprise by leveraging a domain-oriented, self-serve design. Borrowing Eric Evans’ theory of domain-driven design, a flexible, scalable software development paradigm that matches the structure and language of your code with its corresponding business domain.
Unlike traditional monolithic data infrastructures that handle the consumption, storage, transformation, and output of data in one central data lake, a data mesh supports distributed, domain-specific data consumers and views “data-as-a-product,” with each domain handling their own data pipelines. The tissue connecting these domains and their associated data assets is a universal interoperability layer that applies the same syntax and data standards.
Data meshes federate data ownership among domain data owners who are held accountable for providing their data as products, while also facilitating communication between distributed data across different locations.
While the data infrastructure is responsible for providing each domain with the solutions with which to process it, domains are tasked with managing ingestion, cleaning, and aggregation to the data to generate assets that can be used by business intelligence applications. Each domain is responsible for owning their pipelines, but a set of capabilities applied to all domains that stores, catalogs, and maintains access controls for the raw data. Once data has been served to and transformed by a given domain, the domain owners can then leverage the data for their analytics or operational needs.

The data mesh paradigm is only successful if the data is reliable and trustworthy, and if this “universal interoperability layer” is applied across domains. The only way data can be reliable and trustworthy? A close attention to data quality through testing, monitoring, and observability.
Many companies are adopting the data mesh paradigm, particularly larger organizations with the need for multiple data domains. For instance, in a January 2021 blog article written by Intuit’s former VP of Data Engineering, Mammad Zadeh, and Raji Arasu, Intuit’s SVP of Core Services & Experiences, Intuit positions itself as a “AI-driven expert platform company,” whose platform “collects, processes, and transforms a steady stream of data into a connected mesh of high quality data.” Another example is JPMorgan Chase, which built a data mesh architecture to help them delineate data ownership between discrete analytics functions and improve visibility into data sharing across the enterprise.
Regardless of your perspective on the data mesh, it’s certainly taken the data community by storm and surfaced great conversation (and blog articles) on the future of our distributed data architectures and team structures.
Streaming Data
Streaming data refers to the process of transmitting a continuous flow of data into your pipeline to quickly generate real-time insights. Traditionally, data quality was enforced via testing batch data before it entered production pipelines, but increasingly, businesses are seeking more real-time analysis. While this has the potential to make insights faster, it also opens up greater questions and challenges related to data quality since streaming data is data “in motion.”
Increasingly, organizations are adopting both batch processing and stream processing, which forces data teams to rethink their approach to testing and observing their data.
Rise of the Data Lakehouse
Data warehouse or data lake? That is the question – at least if you ask a data engineer. Data warehouses, a structured data repository, and data lakes, a pool of raw, unstructured data, both rely on high quality data for processing and transformation. Increasingly, data teams are opting to use both data warehouses and data lakes to accommodate the growing data needs of their business. Meet: the data lakehouse.
Data lakehouses first came onto the scene when cloud warehouse providers began adding features that offer lake-style benefits, such as Redshift Spectrum or Databricks Lakehouse. Similarly, data lakes have been adding technologies that offer warehouse-style features, such as SQL functionality and schema. Today, the historical differences between warehouses and lakes are narrowing so you can access the best of both worlds in one package.
This migration to the “lakehouse” model suggests that pipelines are growing more and more complex, and while some might choose one dedicated vendor to tackle both, others are migrating data to multiple storage and processing layers, leading to more opportunities for pipeline data to break even with ample testing.
Summary
The rise of the cloud, distributed data architectures and teams, as well as the move towards data productization have put the onus on data leaders to help their companies drive towards more trustworthy analytics and the data powering them. Achieving reliable data is a marathon, not a sprint, and involves many stages of your data pipeline. Further, committing to improving data quality is much more than a technical challenge; it’s very much organizational and cultural, too. In the next chapter, we’ll discuss some technologies your team can use to prevent broken pipelines and build repeatable, iterative processes and frameworks with which to better communicate, address, and even prevent data downtime.
Access the full book, here.
Interested in learning how you can solve data quality at scale across your organization? Reach out to Molly and the rest of the Monte Carlo team.
Our promise: we will show you the product.
Read more posts.