5 Ways You Can Use ChatGPT Vision for Data Analysis
Enhances data analysis by interpreting visual data, including math formula, data extraction, evaluating the results, dashboards, and charts.
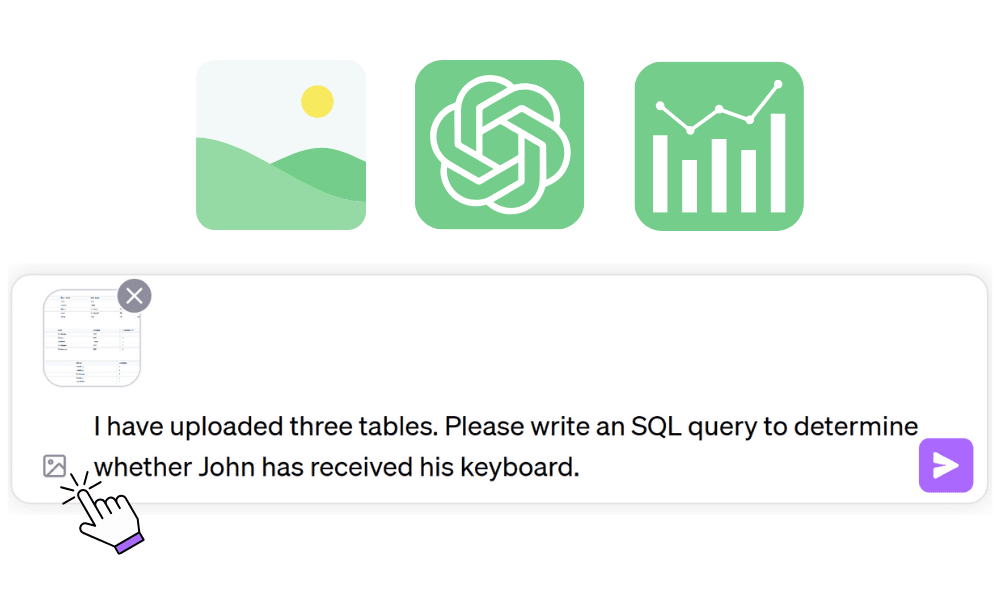
Image by Author
Data analysis is a crucial part of making data-driven decisions in business, research, and everyday life. It involves extracting insights and patterns from data to gain a deeper understanding of the underlying information. With the introduction of ChatGPT's new Vision capability, data analysis has taken a significant leap forward. ChatGPT Vision allows users to interpret images, equations, graphs, and charts, opening up a wide range of possibilities for extracting insights from visual data.
In this article, we will explore 5 key ways ChatGPT Vision can be used for data analysis tasks.
1. SQL Table
You can now simply take the screenshot of the dataset and ask ChatGPT to write a SQL query for you.
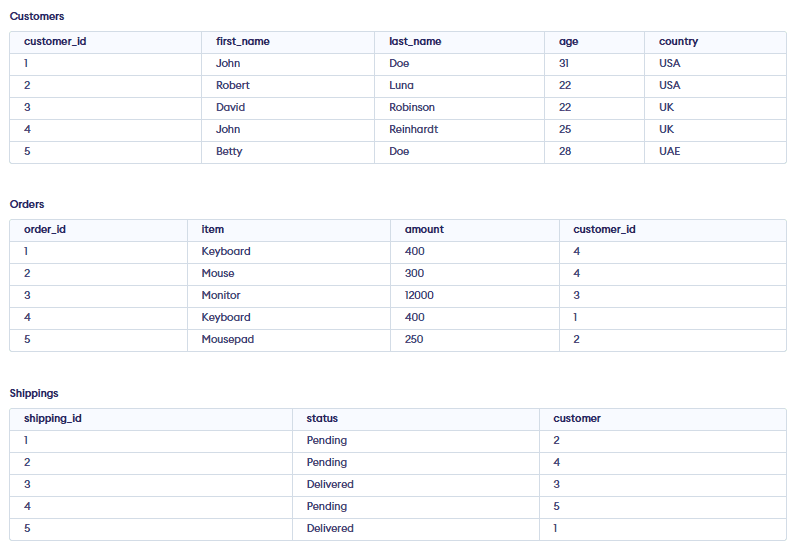
Demo Database from programiz.com
Prompt:
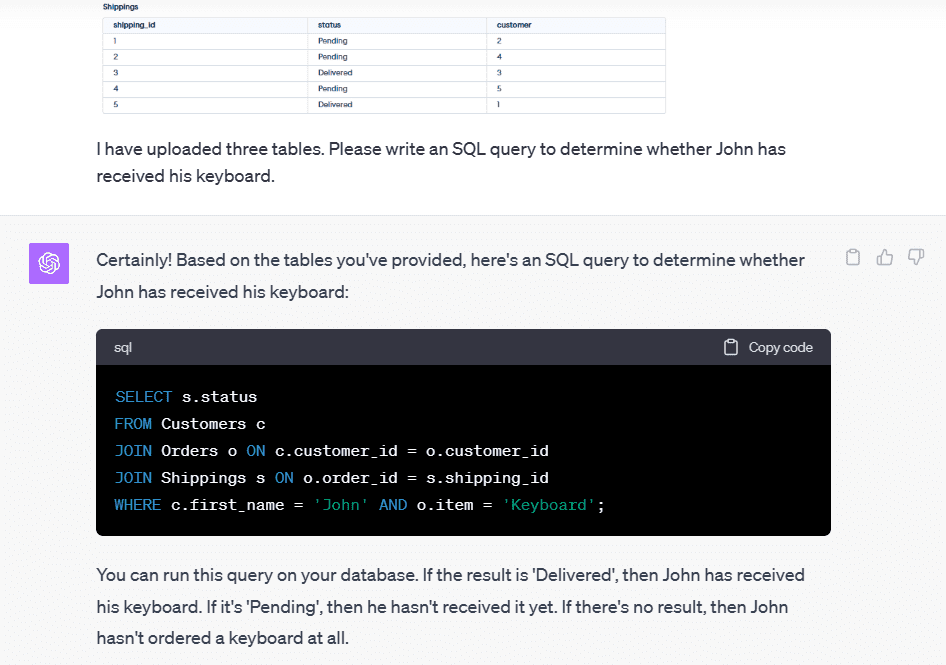
I have uploaded three tables. Please write an SQL query to determine whether John has received his keyboard.
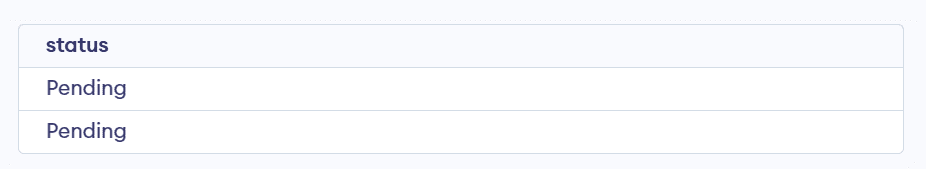
As we can see, the SQL query ran perfectly and I got my answer (Pending) too.
SELECT s.status
FROM Customers c
JOIN Orders o ON c.customer_id = o.customer_id
JOIN Shippings s ON o.order_id = s.shipping_id
WHERE c.first_name = 'John' AND o.item = 'Keyboard';
Result:
The ChatGPT Vision functionality enables non-technical managers to run queries on multiple relational tables and complex questions.
2. Chart Analysis
Using ChatGPT Vision for chart analysis is the best way to understand what each graph is telling you about.
In our case, we have provided multiple images of data analysis plots from the Evolution of Digital Learning During COVID19 notebook and asked ChatGPT to write us the detailed report.
Prompt:
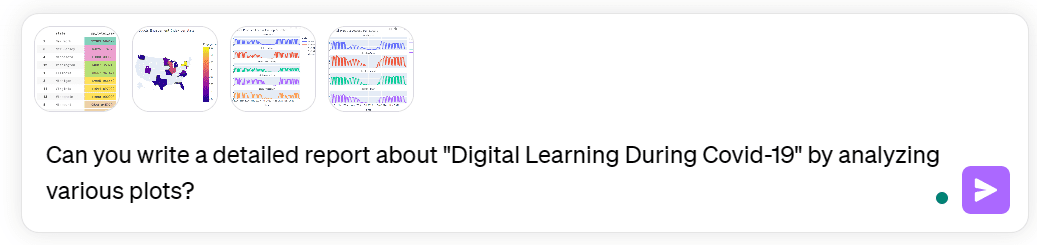
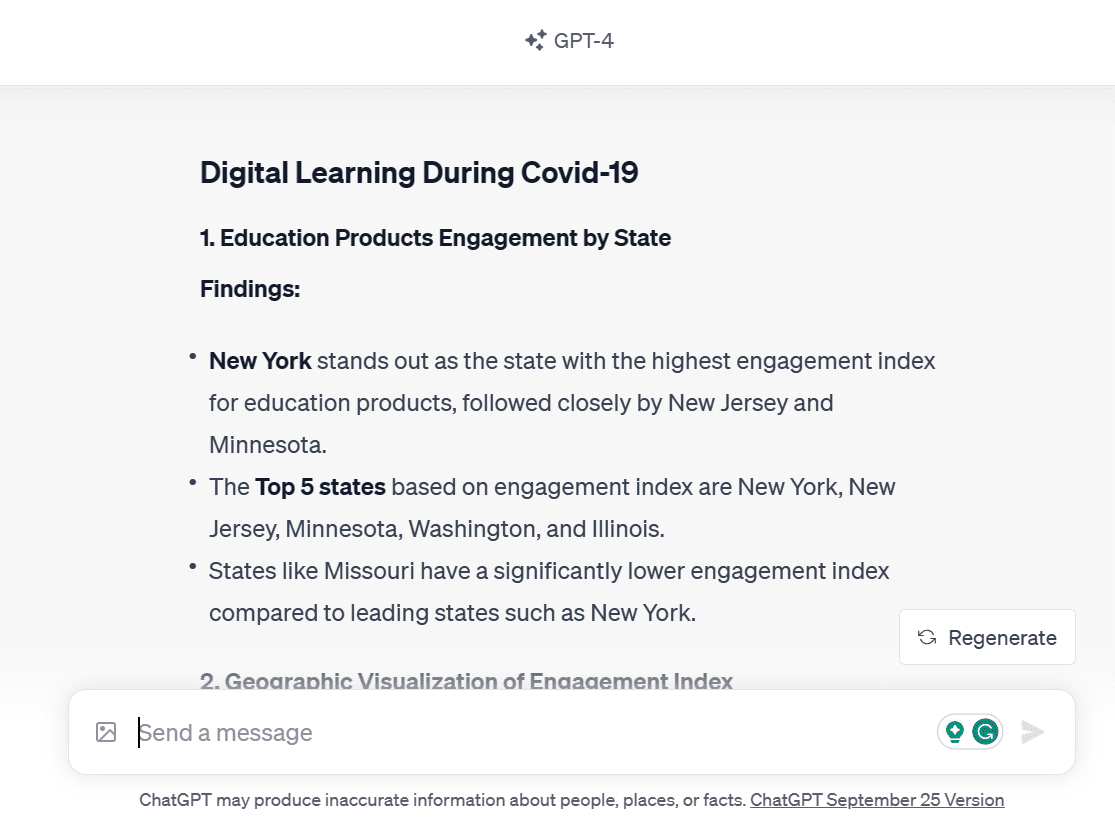
As a data scientist, it can often take a full day to create a proper data analysis report. However, with ChatGPT, we were able to produce the report within a minute. It was able to identify hidden patterns that I had missed during my initial analysis. Once again, ChatGPT Vision proved to be a valuable and reliable assistant.
3. Dashboard
Next, we will provide a more complex image of the Super Sample Superstore dashboard to help understand each component and its meaning.
Prompt:
Can you please explain each dashboard section in detail?
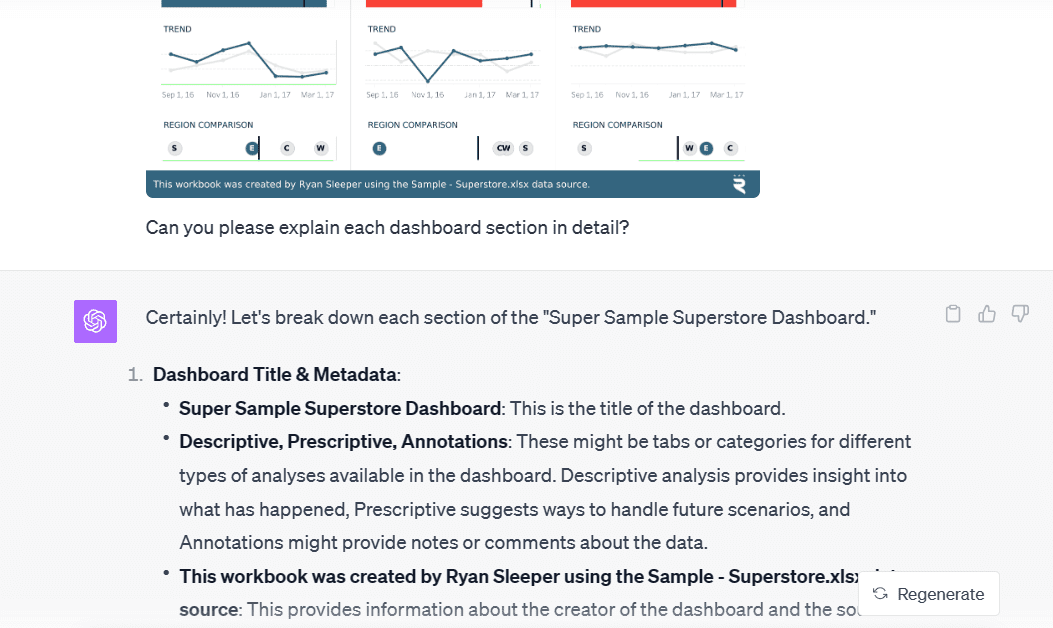
ChatGPT did a great job by providing a detailed explanation of the dashboard from a simple prompt. Additionally, it explained the numbers and charts on the dashboard, such as KPIs, trends, and regional comparisons.
4. Evaluation
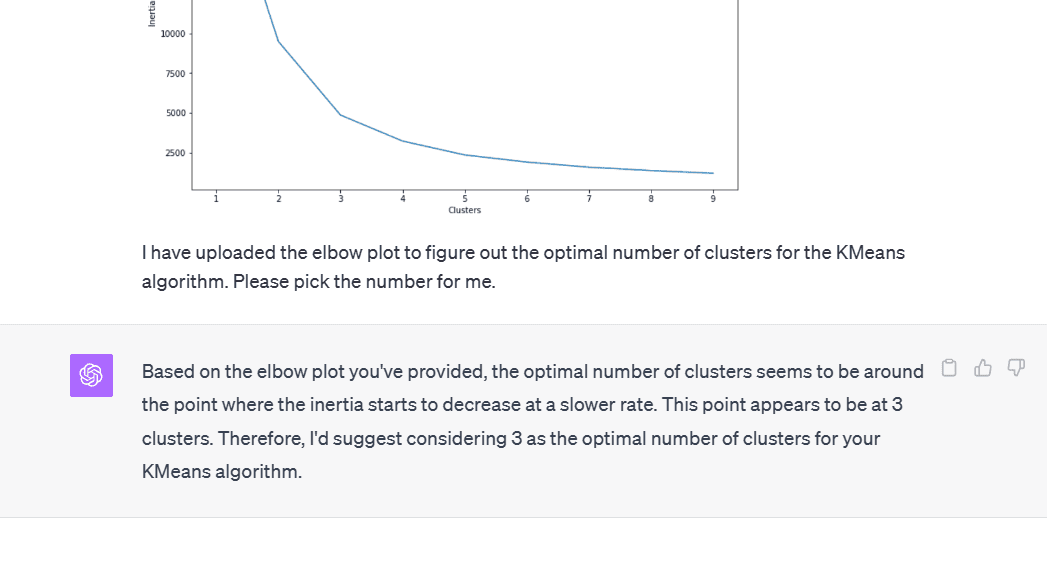
I often struggle with evaluating results and making sense of them. For instance, when I am trying to determine the best number of clusters for the KMeans algorithm using the Alcoholic Drinks Promotion in Russia dataset. So, instead of checking for multiple clusters, I will provide an Elbow plot to ChatGPT Vision and ask it to pick a number for me.
Prompt:
I have uploaded the elbow plot to figure out the optimal number of clusters for the KMeans algorithm. Please pick the number for me.
You can also use this new functionality to better understand the machine learning results. For example, to understand the classification report of the Mobile Price classification model.
Prompt:
I have uploaded the classification report of Mobile Price Classification. Can you please explain the result?
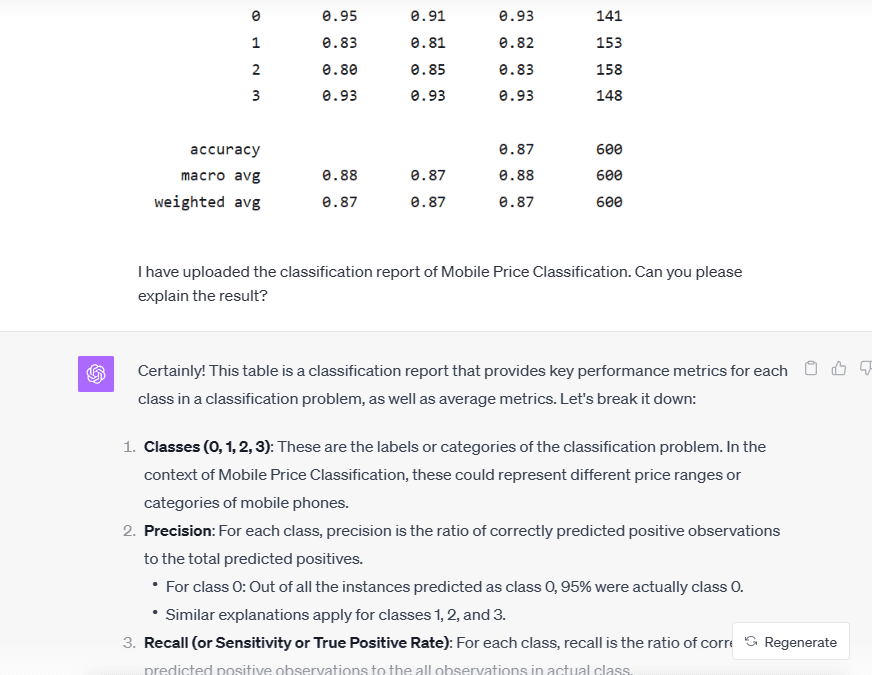
Using these results, I can easily explain our initial results to my non-technical manager and stakeholders. It just made my life easy.
5. Equations
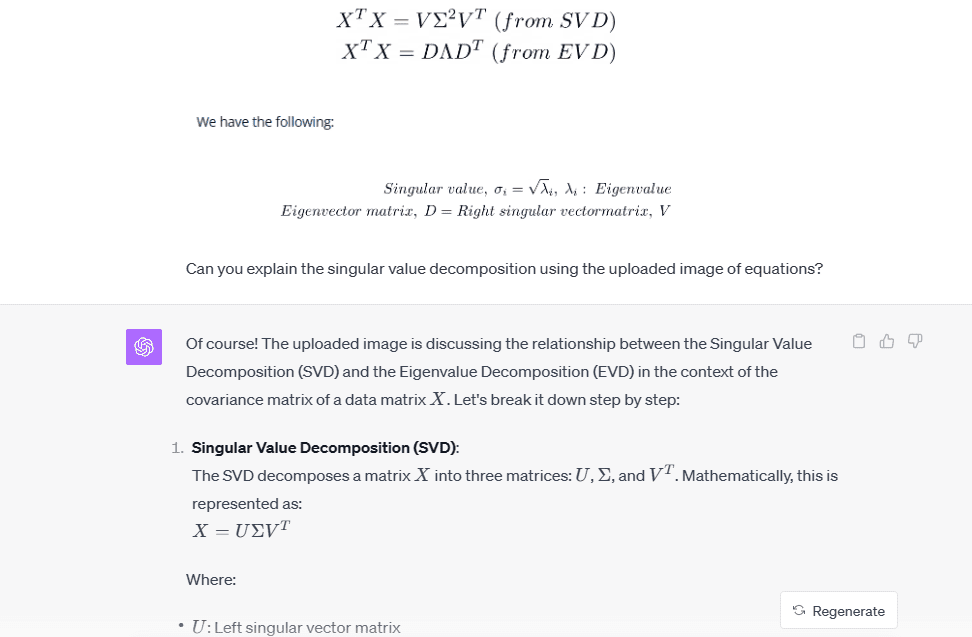
The best use of ChatGPT Vision is to use it to understand various math equations on research papers, websites, videos, and blogs. You can just take a screenshot of the equation and ask ChatGPt to explain it for you in simple words. Like we asked it to explain the equation of singular value decomposition.
Prompt:
Can you explain the singular value decomposition using the uploaded image of equations
In another example, we will be asking ChatGPT to convert the reward function from Fine-Tuning Language Models from Human Preferences research paper into Latex.
Prompt:
Can you convert the reward function equation into latex?
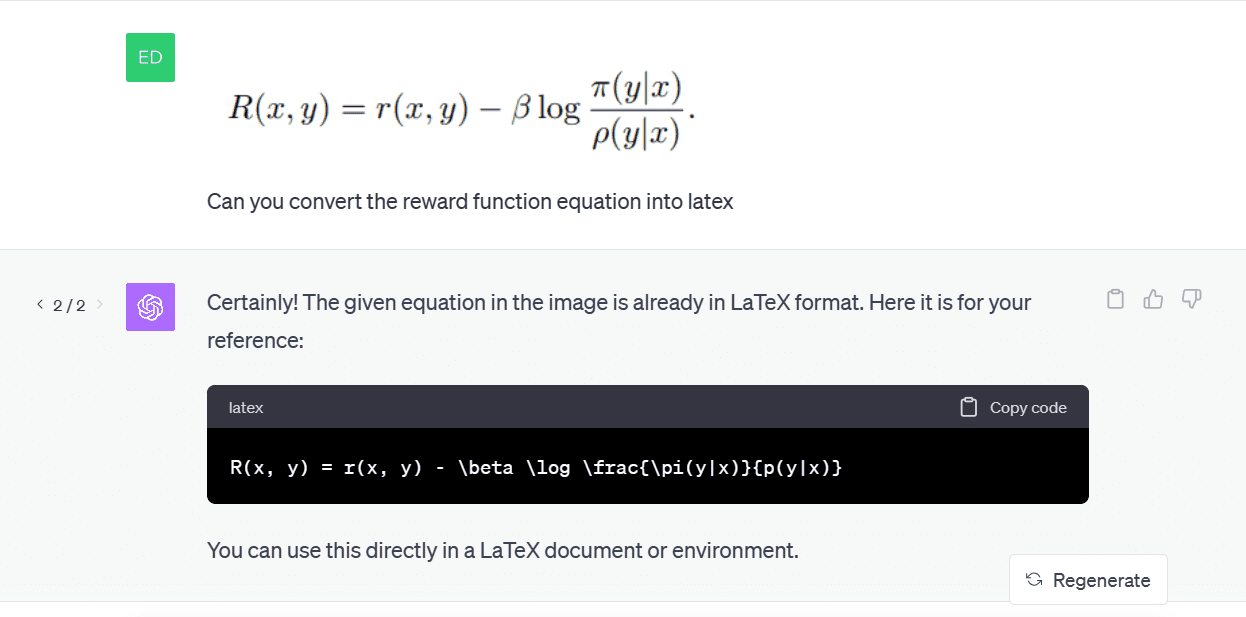
As you can see, the generated Latex code works perfectly.
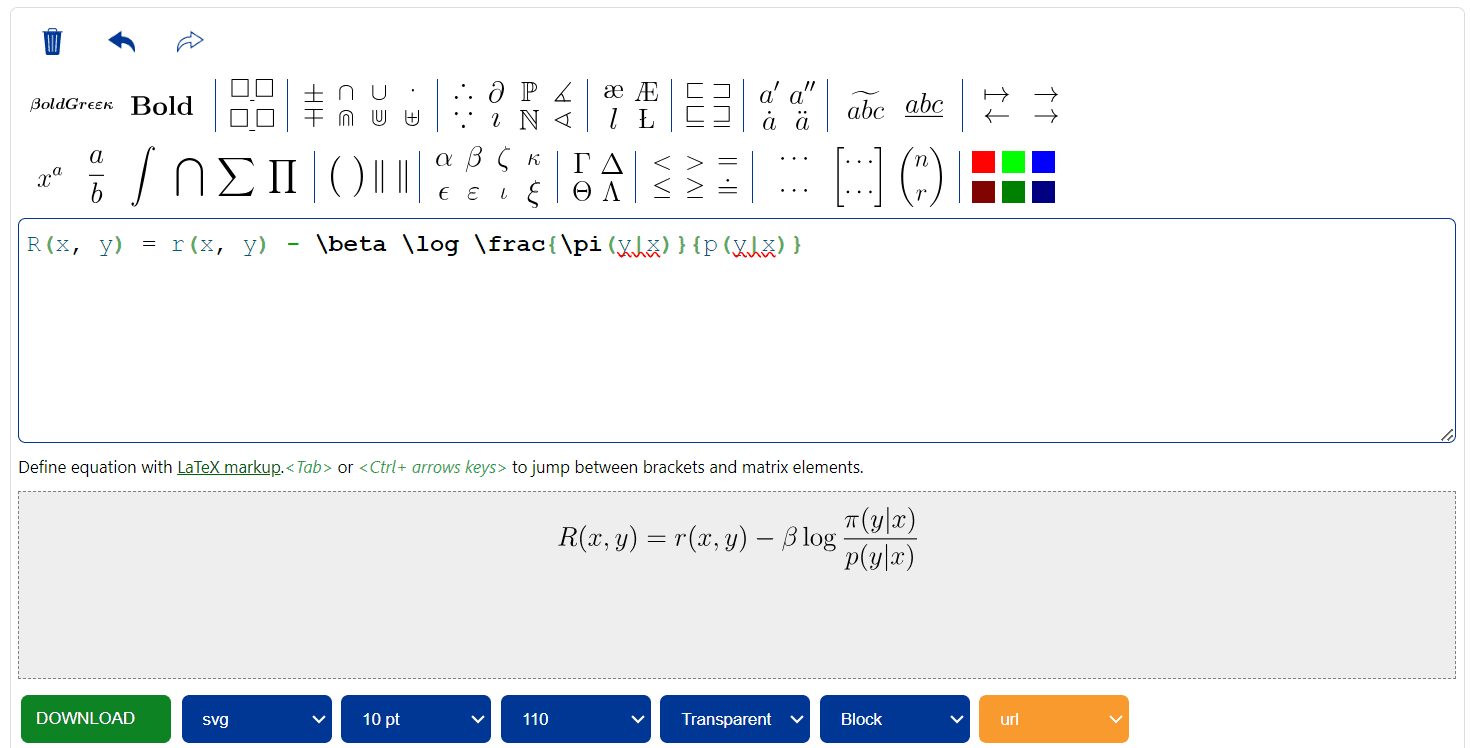
Screenshot from Codecogs
Final Thoughts
With its visual interpretation skills, ChatGPT has become an invaluable assistant for data scientists, analysts, researchers and even non-technical professionals looking to work with data. It eliminates the need for manual analysis and speeds up the process of going from data to insights. As the capabilities continue to improve, ChatGPT Vision promises to revolutionize the way we work with and understand data.
Abid Ali Awan (@1abidaliawan) is a certified data scientist professional who loves building machine learning models. Currently, he is focusing on content creation and writing technical blogs on machine learning and data science technologies. Abid holds a Master's degree in technology management and a bachelor's degree in telecommunication engineering. His vision is to build an AI product using a graph neural network for students struggling with mental illness.