Build Your Own PandasAI with LlamaIndex
Learn how to leverage LlamaIndex and GPT-3.5-Turbo to easily add natural language capabilities to Pandas for intuitive data analysis and conversation.

Image by Author
Introduction
Pandas AI is a Python library that leverages the power of generative AI to supercharge Pandas, the popular data analysis library. With just a simple prompt, Pandas AI allows you to perform complex data cleaning, analysis, and visualization that previously required many lines of code.
Beyond crunching the numbers, Pandas AI understands natural language. You can ask questions about your data in plain English, and it will provide summaries and insights in everyday language, sparing you from deciphering complex graphs and tables.
In the example below, we provided a Pandas dataframe and asked the generative AI to create a bar chart. The result is impressive.
pandas_ai.run(df, prompt='Plot the bar chart of type of media for each year release, using different colors.')
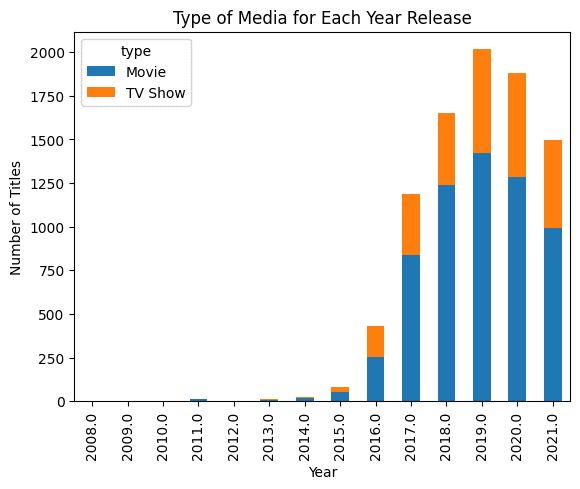
Note: the code example is from Pandas AI: Your Guide to Generative AI-Powered Data Analysis tutorial.
In this post, we will be using LlamaIndex to create similar tools that can understand the Pandas data frame and produce complex results as shown above.
LlamaIndex enables natural language querying of data via chat and agents. It allows large language models to interpret private data at scale without retraining on new data. It integrates large language models with various data sources and tools. LlamaIndex is a data framework that allows for the easy creation of Chat with PDF applications with just a few lines of code.
Setting Up
You can install the Python library by using the pip command.
pip install llama-index
By default, LlamaIndex uses OpenAI gpt-3.5-turbo model for text generation and text-embedding-ada-002 for retrieval and embeddings. To run the code hassle-free, we must set up the OPENAI_API_KEY. We can register and get the API key for free on a new API token page.
import os
os.environ["OPENAI_API_KEY"] = "sk-xxxxxx"
They also support integrations of Anthropic, Hugging Face, PaLM, and more models. You can learn everything about it by reading the Module's documentation.
Pandas Query Engine
Let’s get to the main topic of creating your own PandasAI. After installing the library and setting up the API key, we will create a simple city dataframe with the city name and population as the columns.
import pandas as pd
from llama_index.query_engine.pandas_query_engine import PandasQueryEngine
df = pd.DataFrame(
    {"city": ["New York", "Islamabad", "Mumbai"], "population": [8804190, 1009832, 12478447]}
)
Using the PandasQueryEngine, we will create a query engine to load the dataframe and index it.
After that, we will write a query and display the response.
query_engine = PandasQueryEngine(df=df)

response = query_engine.query(
    "What is the city with the lowest population?",
)
As we can see, it has developed the Python code for displaying the least populated city in the dataframe.
> Pandas Instructions:
```
eval("df.loc[df['population'].idxmin()]['city']")
```
eval("df.loc[df['population'].idxmin()]['city']")
> Pandas Output: Islamabad
And, if you print the response, you will get "Islamabad." It is simple but impressive. You don't have to come up with your own logic or experiment around the code. Just type the question, and you will get the answer.
print(response)
Islamabad
You can also print the code behind the result using the response metadata.
print(response.metadata["pandas_instruction_str"])
eval("df.loc[df['population'].idxmin()]['city']")
Global YouTube Statistics Analysis
In the second example, we will load the Global YouTube Statistics 2023 dataset from Kaggle and perform some fundamental analysis. It is a step up from the simple examples.
We will use read_csv to load the dataset into the query engine. Then we will write the prompt to display only columns with missing values and the number of missing values.
df_yt = pd.read_csv("Global YouTube Statistics.csv")
query_engine = PandasQueryEngine(df=df_yt, verbose=True)

response = query_engine.query(
    "List the columns with missing values and the number of missing values. Only show missing values columns.",
)
> Pandas Instructions:
```
df.isnull().sum()[df.isnull().sum() > 0]
```
df.isnull().sum()[df.isnull().sum() > 0]
> Pandas Output: category                                    46
Country                                    122
Abbreviation                               122
channel_type                                30
video_views_rank                             1
country_rank                               116
channel_type_rank                           33
video_views_for_the_last_30_days            56
subscribers_for_last_30_days               337
created_year                                 5
created_month                                5
created_date                                 5
Gross tertiary education enrollment (%)    123
Population                                 123
Unemployment rate                          123
Urban_population                           123
Latitude                                   123
Longitude                                  123
dtype: int64
Now, we will ask direct questions about popular channel types. In my opinion, the LlamdaIndex query engine is highly accurate and has not yet produced any hallucinations.
response = query_engine.query(
    "Which channel type have the most views.",
)
> Pandas Instructions:
```
eval("df.groupby('channel_type')['video views'].sum().idxmax()")
```
eval("df.groupby('channel_type')['video views'].sum().idxmax()")
> Pandas Output: Entertainment
Entertainment
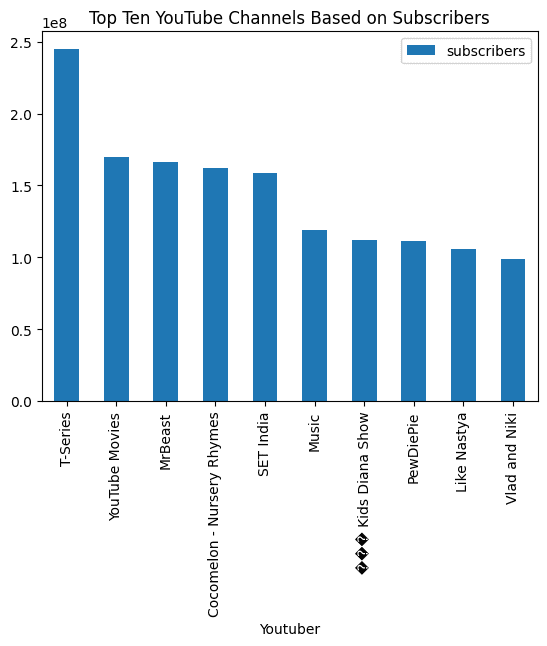
In the end, we will ask it to visualize barchat and the results are amazing.
response = query_engine.query(
    "Visualize barchat of top ten youtube channels based on subscribers and add the title.",
)
> Pandas Instructions:
```
eval("df.nlargest(10, 'subscribers')[['Youtuber', 'subscribers']].plot(kind='bar', x='Youtuber', y='subscribers', title='Top Ten YouTube Channels Based on Subscribers')")
```
eval("df.nlargest(10, 'subscribers')[['Youtuber', 'subscribers']].plot(kind='bar', x='Youtuber', y='subscribers', title='Top Ten YouTube Channels Based on Subscribers')")
> Pandas Output: AxesSubplot(0.125,0.11;0.775x0.77)
With a simple prompt and query engine, we can automate our data analysis and perform complex tasks. There is so much more to LamaIndex. I highly recommend you to read the official documentation and try to build something amazing.
Conclusion
In summary, LlamaIndex is an exciting new tool that allows developers to create their own PandasAI - leveraging the power of large language models for intuitive data analysis and conversation. By indexing and embedding your dataset with LlamaIndex, you can enable advanced natural language capabilities on your private data without compromising security or retraining models.
This is just a start, with LlamaIndex you can build Q&A over documents, Chatbots, Automated AI, Knowledge Graph, AI SQL Query Engine, Full-Stack Web Application, and build private generative AI applications.
Abid Ali Awan (@1abidaliawan) is a certified data scientist professional who loves building machine learning models. Currently, he is focusing on content creation and writing technical blogs on machine learning and data science technologies. Abid holds a Master's degree in Technology Management and a bachelor's degree in Telecommunication Engineering. His vision is to build an AI product using a graph neural network for students struggling with mental illness.