5 Python Packages For Geospatial Data Analysis
This article discusses the importance of geospatial analysis and introduces five essential Python packages for effectively handling and visualizing valuable insights from geospatial data.
Introduction
Geospatial data analysis is critical in urban planning, environmental research, agriculture, and transportation industries. The growing need has led to an increase in the use of Python packages for various geographic data analysis requirements, such as analyzing climate patterns, investigating urban development, or tracking the spread of diseases, among others. Evaluating and selecting the right tools with quick processing, modification, and visualization capabilities is essential to effectively analyze and visualize geospatial data.
Understanding Geospatial Data
It is essential first to understand what geospatial data is. Geospatial data is data with a geographic or geographical component representing the position and qualities of objects, features, or occurrences on the Earth's surface. It describes the spatial connections, distributions, and properties of diverse items in the physical universe. Geospatial data is primarily of two types:
- Raster data: It is suitable for continuous information without fixed borders, represented as a grid of cells with values indicating observed features. It is often monitored at regular intervals and interpolated to create a continuous surface.
- Vector data: It uses points, lines, and polygons to represent spatial properties, including points of interest, transportation networks, administrative boundaries, and land parcels, often used for discrete data with precise positions or hard constraints.
Geospatial data may be stored in a variety of formats, such as:
- ESRI Shapefile
- GeoJSON
- Erdas Imagine Image File Format (EIF)
- GeoTIFF, Geopackage (GPKG)
- GeoJSON, Light Detection
- Ranging (LiDAR), and many others.
Geospatial data encompasses various types, such as satellite images, elevation models, point clouds, land use classifications, and text-based information, offering valuable insights for spatial analysis and decision-making across industries. Major corporations like Microsoft, Google, Esri, and Amazon Web Services leverage geospatial data for valuable insights. Let's explore the top five Python packages for geospatial data analysis. These packages enable data reading/writing, manipulation, visualization, geocoding, and geographical indexing, catering to beginners and experienced users. Discover how these packages empower effective exploration, visualization, and insights extraction from geospatial data. Let's begin!
1. Geopandas
Suitable for: Vector Data
Geopandas is a widely used Python library for working with vector geospatial data, providing intuitive geographic data handling in Pandas DataFrames. It supports formats like Shapefiles and GeoJSON and offers spatial operations such as merging, grouping, and spatial joins. Geopandas integrates seamlessly with popular libraries like Pandas, NumPy, and Matplotlib. It can handle large datasets, but this can pose challenges. Geopandas package is commonly used for spatial data analysis tasks, including spatial joins, queries, and geospatial operations like buffering and intersection analysis. Geopandas requires different packages like Shapely to handle geometric operations, Fiona to access files, and matplotlib for plotting.
For example, Geopandas can be used to explore real estate data to identify the most expensive neighborhoods in a city or to analyze population data to visualize the growth and migration patterns of different communities.
We can use pip to install the package:
pip install geopandas
Plotting with GeoPandas
Let us view the built-in maps as shown below:
import geopandas
# Check available maps
geopandas.datasets.available
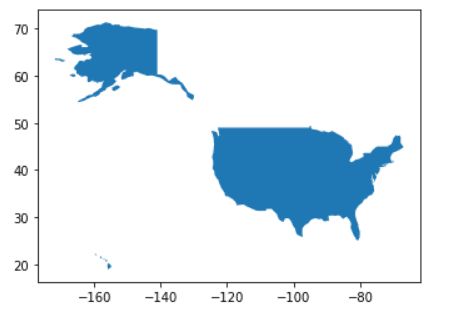
We will use Geopandas to load a dataset of the world map, extract the shapefile for the United States, and plot it on a graph with the following code:
# Selecting a particular map
geopandas.datasets.get_path('naturalearth_lowres')
# Open the selected map - GeoDataFrame
world = geopandas.read_file(geopandas.datasets.get_path('naturalearth_lowres'))
# Create a subset of the GeoDataFrame
usa = world[world.name == "United States of America"]
# Plot the subset
usa.plot();
The above code prints a map of the subset data frame:
2. Folium
Suitable for: Point clouds
Folium is a Python library for creating interactive maps with markers, pop-ups, choropleths, and other geospatial visualizations. It integrates with the Leaflet JavaScript library and allows exporting maps to HTML. It can be combined with Geopandas and Cartopy and handles large datasets using Map Tiles. Folium excels in simplicity, aesthetics, and integration with other geospatial libraries. However, for advanced geospatial analysis and manipulation, Folium may have limitations.
For example, Folium could be utilized in supply chain and logistics for visualizing distribution networks, optimizing routes, and monitoring shipment locations.
We can install Folium with the following command:
pip install folium
Plotting with Folium
Let us print a sample interactive map centered at [0, 0] with a marker placed at the same location with the following lines of code:
import folium
# Generate a Folium map with center coordinates (0, 0)
map = folium.Map(location=[0, 0], zoom_start=2)
# Locate the coordinates 0, 0
folium.Marker([0, 0]).add_to(map)
# Display the map
map
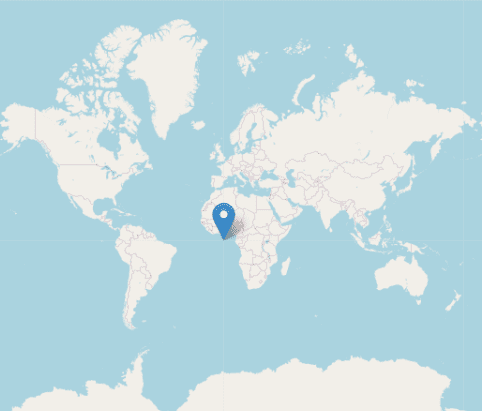
This map can be customized further by adding markers, layers, or styling options based on specific geospatial data.
3. ipyleaflet
Suitable for: Point clouds, interactive
The ipyleaflet package enables the easy creation of interactive maps in Python, particularly within Jupyter notebooks, allowing users to generate and share interactive maps with various basemaps, markers, and other geospatial operations. Built on the leaflet JavaScript library, ipyleaflet supports GeoJSON and WMS layers, CSS and JavaScript styling, and geospatial calculations. While ipyleaflet excels in interactive widgets, it may not be ideal for pure Python-based projects due to its JavaScript dependency.
For example, ipyleaflet can be applied in environmental monitoring to visualize sensor data, monitor air quality, and assess environmental changes in real time.
To install ipyleaflet, we use the pip command:
pip install ipyleaflet
Plotting with ipyleaflet
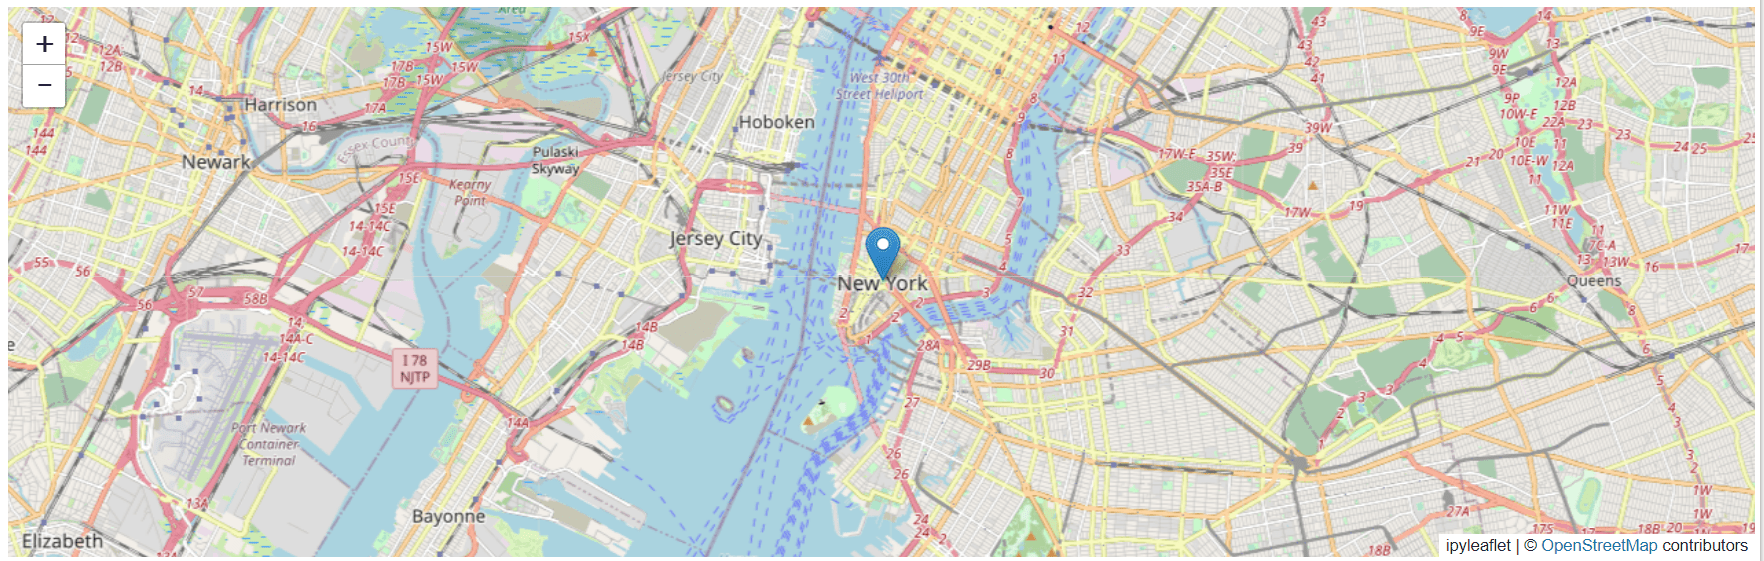
Let us create an interactive map with a marker placed at the coordinates (40.7128, -74.0060) to represent a point of interest in New York City using the code below:
from ipyleaflet import Map, Marker
# Create the map
m = Map(center=(40.7128, -74.0060), zoom=12)
# Add the market
marker = Marker(location=(40.7128, -74.0060))
m.add_layer(marker)
Here is an output for the code:
4. Rasterio
Suitable for: Raster data
Rasterio is a powerful Python library for working with geospatial raster data, offering efficient performance and a wide range of operations like cropping, reprojecting, and resampling. It supports various raster formats and integrates well with other geospatial libraries, although it has limitations in handling vector data and complex analysis tasks. Nevertheless, Rasterio is an essential tool for efficient raster data manipulation and processing in Python.
For example, rasterio can be used in tasks such as reading and writing satellite imagery, performing terrain analysis, extracting data from digital elevation models, and conducting remote sensing analysis.
!pip install rasterio
The rasterio.open() function opens the file, and the read() method reads the image as a numpy array. Finally, the plt.imshow() function from Matplotlib is used to display the image, and plt.show() shows the plot in the output.
Plotting with rasterio
import rasterio
from rasterio.plot import show
We use the rasterio library to open and visualize a raster image from the 'sample.tif' file from the dataset ‘High-resolution GeoTIFF images of climatic data’ on kaggle, displaying the red channel (one of the color channels in the image) as a subplot with a Reds color map, and the original image (comprising multiple color channels) as another subplot with a viridis color map. Other color channels, such as green and blue, can also be visualized using this approach.
src = rasterio.open('/content/sample.tif')
plt.figure(figsize=(15,10))
fig, (axr, axg) = plt.subplots(1,2, figsize=(15,7))
show((src, 1), ax=axr, cmap='Reds', title='red channel')
show((src), ax=axg, cmap='viridis', title='original image')
plt.show()
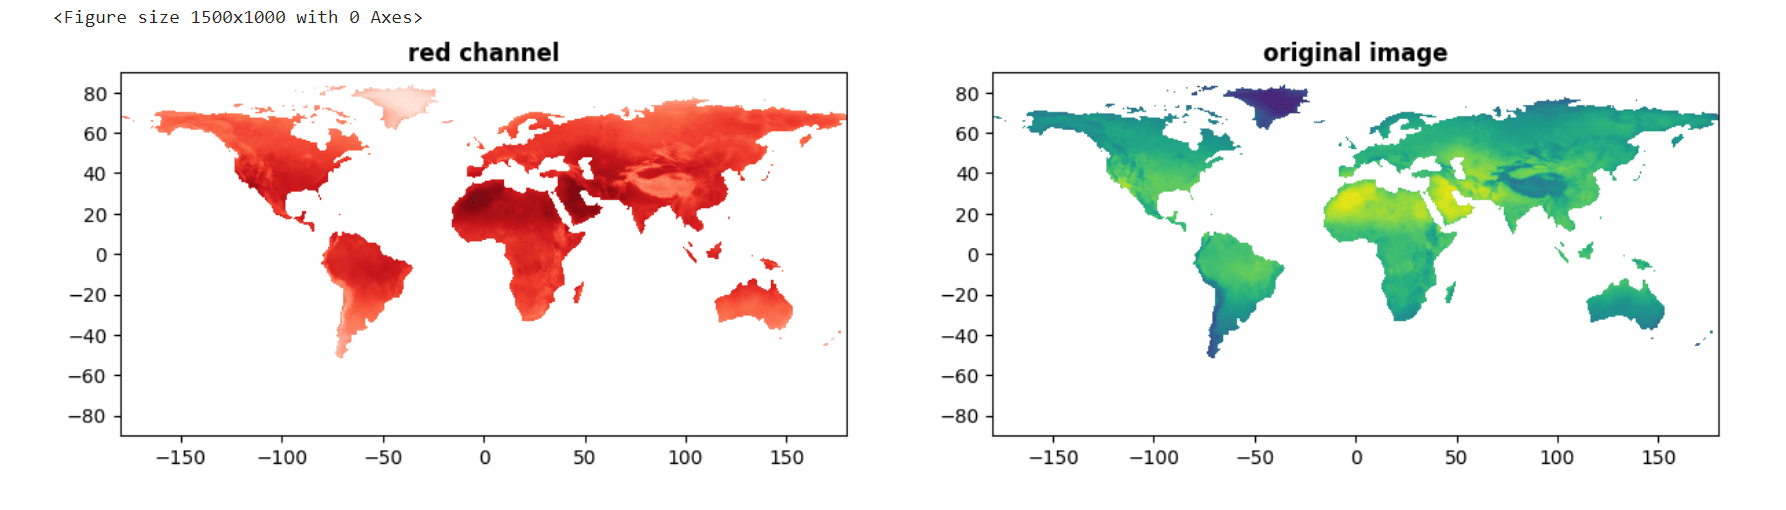
Original GeoTIFF Image (right) source: kaggle.com
Analyzing specific color channels such as red, blue, and green in geospatial analysis is done to focus on or extract valuable information related to specific attributes, features, or characteristics represented by those color components of the image. Examples could include vegetation health in remote sensing, vegetation indices or water bodies, etc.
5. Geoplot
Suitable for: vector data, interactive
Geoplot is a user-friendly Python library for quickly creating visually appealing geospatial visualizations, including choropleth maps and scatter plots. It seamlessly integrates with popular data manipulation libraries like Pandas and supports multiple map projections. However, Geoplot has limitations regarding interactive map support and a smaller range of plot types than specialized geospatial libraries. Nonetheless, it remains valuable for quick geospatial data visualization and gaining insights into spatial patterns.
!pip install geoplot
Plotting with geoplot
We will plot a choropleth map visualization using Geoplot, where we select the Asian countries from a world shapefile based on the "continent" attribute, assign the color intensity based on the "pop_est" attribute, and plot the map using the "icefire" color map with a legend with a figure size of 10 by 5.
import geoplot
#Plotting population for Asia
asia = world.query("continent == 'Asia'")
geoplot.choropleth(asia, hue = "pop_est", cmap = "icefire",legend=True, figsize = (10, 5));
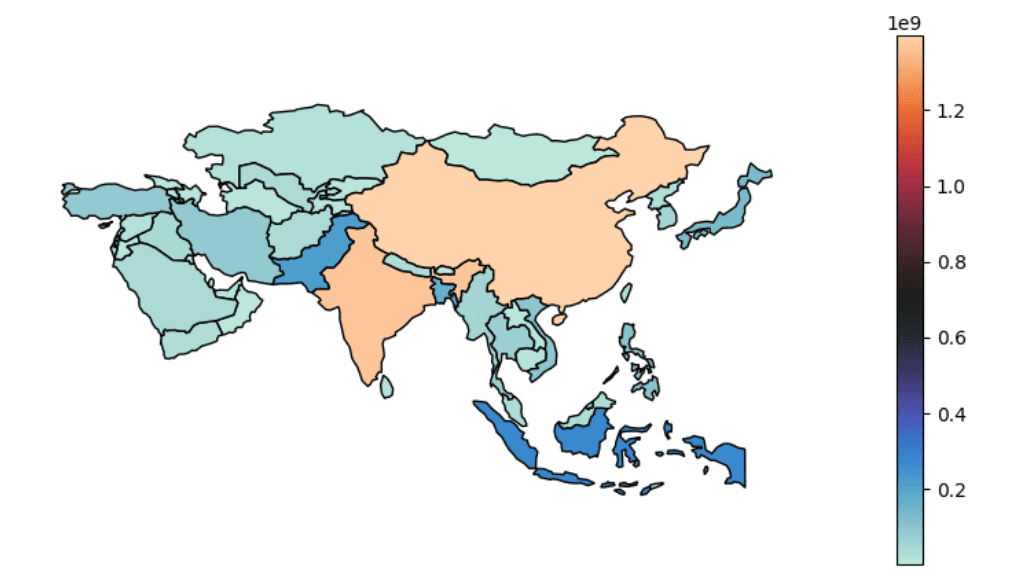
For example, the geoplot package can create choropleth maps to visualize population density, plot spatial patterns of crime incidents, display the distribution of environmental factors, and analyze the spread of diseases based on geographical data.
Conclusion
In conclusion, the geospatial Python packages help effectively analyze location-based information. Each of the discussed packages has its strengths and weaknesses, but together they can form a powerful suite of Python tools when working with geospatial data. So, for beginners or seasoned GIS professionals, these packages are valuable for analyzing, visualizing, and manipulating geospatial data in new and innovative ways.
You can find the code for this article on my GitHub repository here.
If you found this article insightful, connect with me on LinkedIn and Twitter. Remember to follow me on Kaggle, where you can access my machine learning and deep learning projects, notebooks, and captivating data visualizations.
Devashree Madhugiri holds an M.Eng degree in Information Technology from Germany and has a background in Data Science. She likes working on different Machine Learning and Deep Learning projects. She enjoys sharing her knowledge in AI by writing technical articles related to data visualization, machine learning, computer vision on various technological platforms. She is currently a Kaggle Notebooks Master and loves solving Sudoku puzzles in her leisure time.