Business Analyst infographics are powerful tools for analyzing and consolidating geographic information and—perhaps just as importantly—for presenting that information to others. In addition to running infographics, you can also build infographic templates in the following applications:
- ArcGIS Business Analyst Web App (Advanced license)
- ArcGIS Community Analyst
- ArcGIS Business Analyst Pro

Building infographics is more than juxtaposing variables, maps, and graphics. There is quite a bit of design involved if you want your template to look just right. A helpful aspect is the theme, which sets the defaults for your template’s background, icons, and text styling. It also provides the option to choose a background image and customize colors, fonts and settings. This article will walk you through some recommended best practices.
Themes
The theme for an infographic template consists of colors, font, and background image settings. It gives the template a unified look across its multiple panels and pages. You can also leverage the theme to give a template an appearance that helps visually tie it together with your organization’s website or publicity materials.
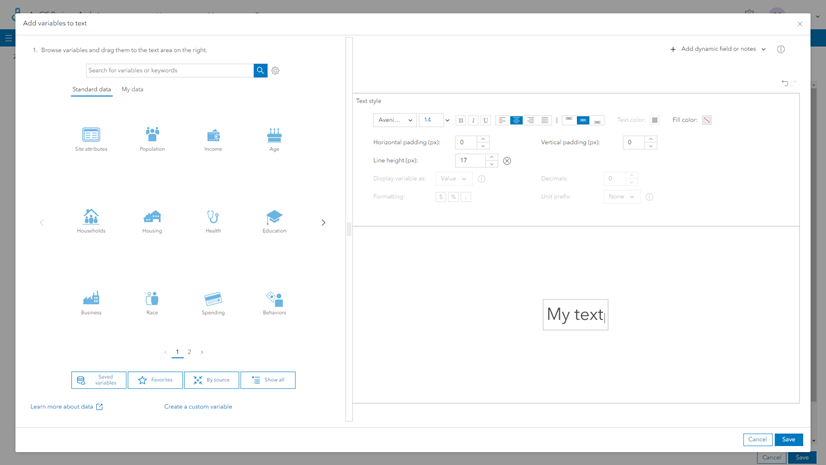
Custom infographic templates use the default color theme and font, but you can click Theme to modify those settings. You can also further customize the theme by applying a background image and using Advanced options. We will now consider a scenario and use it as an example to understand a few recommended best practices for modifying themes. We will also refer to some of the user interface controls that are used to implement modifications to themes.
Suppose that your organization is a large real estate agency and offers the Housing Market Characteristics infographic to their clients for their areas of interest. You want to modify the theme so that its appearance is like your organization’s website and promotional materials. To start:
- Set the Icon color to match your organization’s brand color (green)

- Apply the same background image used on your organization’s homepage.

Your initial customized template may then look like this:

In the next 3 sections we will look at recommended best practices regarding color, branding, and text, and apply them to refine your initial customized theme.
Color
- Use color to communicate meaning and emphasis, rather than decoration.
- Use color consistently, to create a familiar and engaging experience. For greater impact, use color sparsely.
The background image used is an aesthetic design choice for your real estate agency’s homepage and other materials, as it is evocative of high-quality interior finishes. However, applied as the background for your infographic, it is too decorative and busy, and distracts from the key housing market data presented. You will remove it and set the background color to a uniform lighter gray.
Branding
When use of your organization’s brand color is desired:
- Apply it to emphasized and prioritized elements.
- Avoid overusing it or using it as a background.
Currently the brand color is overused in your template. You will modify the theme to:
- Use the green brand color only on the Title panel and chart headers. Tip: To edit the Title panel color, mouse over it, click Edit, then click Panel options and click on the Background thumbnail to select a different color.
- Select a different visually prominent icon color, which will also draw more attention to the data in the charts.
- Optionally, consider using your organization’s logo in the infographic. See the Logo section in the Best practices for text article for more information.
Text
- Select a text color that is legible when displayed over the selected Background color.
- Exercise care when selecting a background image that differs from the background color.
In your template:
- The dark gray text color does not stand out enough from the light gray shades in the background image. You will change the principal font Text color to black, which will contrast better with the new lighter background color you selected.

- You will also change the white title texts font color to black, to contrast better with the light green branding color.
To modify the color for the Infographic template title itself, mouse over the title panel, click Edit text, click on the Text color thumbnail and select black.
To set the Chart title color to black, click Advanced options, expand the Chart section, click Chart font next to Chart title, and then click on the color thumbnail for Text color, and select the black color.

Tip: Use Contrast Checker to verify that your choice of colors meets accessibility requirements. You can also consider testing the contrast of the template using appropriate tools (for example, Dev tools in Chrome browser) to emulate vision deficiencies.
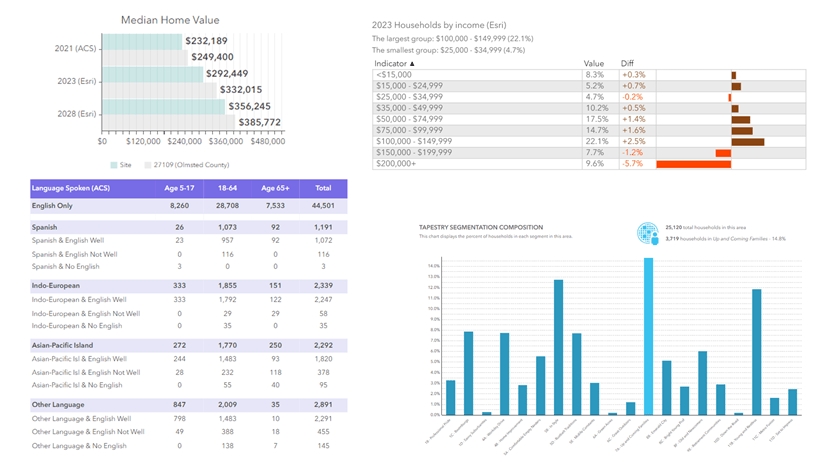
Ok! Now that you’re done incorporating these best practices, here is how your template looks:

It does a much better job conveying the key housing market information while still retaining similarity with the look and feel of your organization’s homepage aesthetics.


Article Discussion: