Just about everyone that uses ArcGIS Pro takes advantage of the powerful sharing functionality. You can distribute important work to a group of colleagues, your entire organization, or even ‘everyone.’ Sharing with everyone allows us to broadcast important data to the public at large, vastly improving access to geospatial data.
However, sharing your work is only useful if the recipient can interact with it. We must ensure that everyone can analyze, interpret, and manipulate the shared content equally, regardless of how they interact with Esri software. This is where accessibility comes in.
Accessibility
Digital accessibility, as defined by the Esri Accessibility team, is “the practice of creating content and digital properties that are usable regardless of person’s physical, cognitive, or behavioral (dis)abilities.”
The goal of accessible development and design is to “reduce technical and functional barriers for people of varying levels of ability. Implementing accessible development also improves the overall usability of our products.”
We are committed to progressing towards this goal by making Business Analyst more accessible to everyone with each release.
The first step towards achieving this goal is to fully understand where accessibility deficiencies exist. To make this happen, a third-party team of accessibility experts conducted a full audit of ArcGIS Pro Business Analyst. As the saying goes, “you can’t fix what you don’t measure.”
Let’s get started: Improving the accessibility of the Four Quadrant Analysis
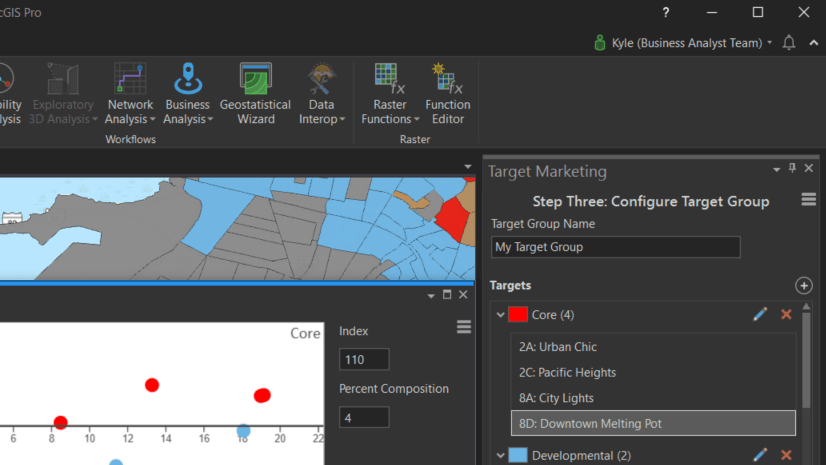
Upon completion and review of the audit, we prioritized the Four Quadrant visualization in the Target Marketing workflow for the first accessibility overhaul. The four quadrant visualization plots each segmentation point along X- and Y- axis. The position of each point indicates the percentage of customers assigned to the segment and the index. The index provides insight into how successfully these consumers are being reached. Users can also define the axis values that bound the quadrants. Prior to the 3.2 release, Business Analyst customers using a method other than eyesight were not able to access the full data story.

Four Quadrant Analysis: Before and after
Prior to 3.2, users were not able to select or focus on the individual four quadrants that make up the visualization.
Additionally, users were not able to focus on the data points in each quadrant that represent consumer segments. This meant that there was no way for screen readers to announce individual elements.
To make the Four Quadrant visualization accessible to everyone, we first addressed these deficiencies so that a viable screen reader experience could be implemented.
Once complete, we summarized the remaining 3.2 accessibility work for the Four Quadrant visualization, with the following goals:
- Provide alternative methods of consuming displayed data.
- Ensure that screen reader announcements are accurate, contextual, and complete.
- Implement a logical and predictable key stroke navigation pattern.
Let’s summarize the work required to achieve each goal and review the results.
Goal: Provide alternative methods of consuming displayed data
To meet this goal, we made the points selectable, and included a hover-over pop-up that presents the point’s values, in text format.
We also added Index and Percent Composition columns to the Target Group pane on the left. The same information that is presented when selecting a point is displayed in the new columns.
Additionally, selecting a point also selects the corresponding segment in the pane on the left, and vice versa.
Lastly, the number of points that fall into each quadrant are listed next to the associated Target name, in the pane on the left.
Providing more than one way to consume data allows customers to choose the option that works best for them.

Goal: Ensure that screen reader announcements are accurate and complete
Once we created individual components that could gain focus, we ensured that descriptions returned by screen readers are meaningful and provide appropriate context. For example, if a user clicks on an individual quadrant, we now return the quadrant name, the quadrant axis value definitions, and the number of points that are contained within it. We also updated element labels, to ensure that the information provided is meaningful, accurate, and complete.
Goal: Implement a logical and predictable key stroke navigation pattern
Prior to 3.2, customers were not able to navigate through or focus on individual components of the visualization, which rendered screen readers ineffective. Once we created individual components that users could keystroke through and focus on, we implemented a keystroke navigation pattern that is both predictable and flexible. For example, if I am using the tab key to explore the individual quadrants, I should expect that I will move from one to the next in clockwise motion with subsequent clicks. I should also have the option to enter a deeper “layer” of elements, like the points contained within. I should then be able to explore the points, but only the ones within the quadrant that I am working in. When I am done there, I need an easy route back out to resume exploring quadrants and their points.
As shown in the video, accessibility improvements to the Target Marketing Four Quadrant Analysis make key stroke navigation viable and screen reader announcements helpful and contextual.
Though there is much work to be done, we are proud of the Business Analyst accessibility improvements in the ArcGIS Pro 3.2 release.
We look forward to continued progress with each release, so that our engaging workflows can be experienced by everyone.


Article Discussion: