Working with Big Data: Tools and Techniques
Where do you start in a field as vast as big data? Which tools and techniques to use? We explore this and talk about the most common tools in big data.

Photo by Nino Souza
Long gone are times in business when all the data you needed was in your ‘little black book’. In this era of the digital revolution, not even the classical databases are enough.
Handling big data became a critical skill for businesses and, with them, data scientists. Big data is characterized by its volume, velocity, and variety, offering unprecedented insights into patterns and trends.
To handle such data effectively, it requires the usage of specialized tools and techniques.
What is Big Data?
No, it’s not simply lots of data.
Big data is most commonly characterized by the three Vs:
- Volume – Yes, the size of the generated and stored data is one of the characteristics. To be characterized as big, the data size must be measured in petabytes (1,024 terabytes) and exabytes (1,024 petabytes)
- Variety – Big data doesn’t only consist of structured but also semi-structured (JSON, XML, YAML, emails, log files, spreadsheets) and unstructured data (text files, images and videos, audio files, social media posts, web pages, scientific data such as satellite images, seismic waveform data, or raw experimental data), with the focus being on the unstructured data.
- Velocity – The speed of generating and processing data.
Big Data Tools and Techniques
All the big data characteristics mentioned impact the tools and techniques we use to handle big data.
When we talk about big data techniques, they are simply methods, algorithms, and approaches we use to process, analyze, and manage big data. On the surface, they are the same as in regular data. However, the big data characteristics we discussed call for different approaches and tools.
Here are some prominent tools and techniques used in the big data domain.
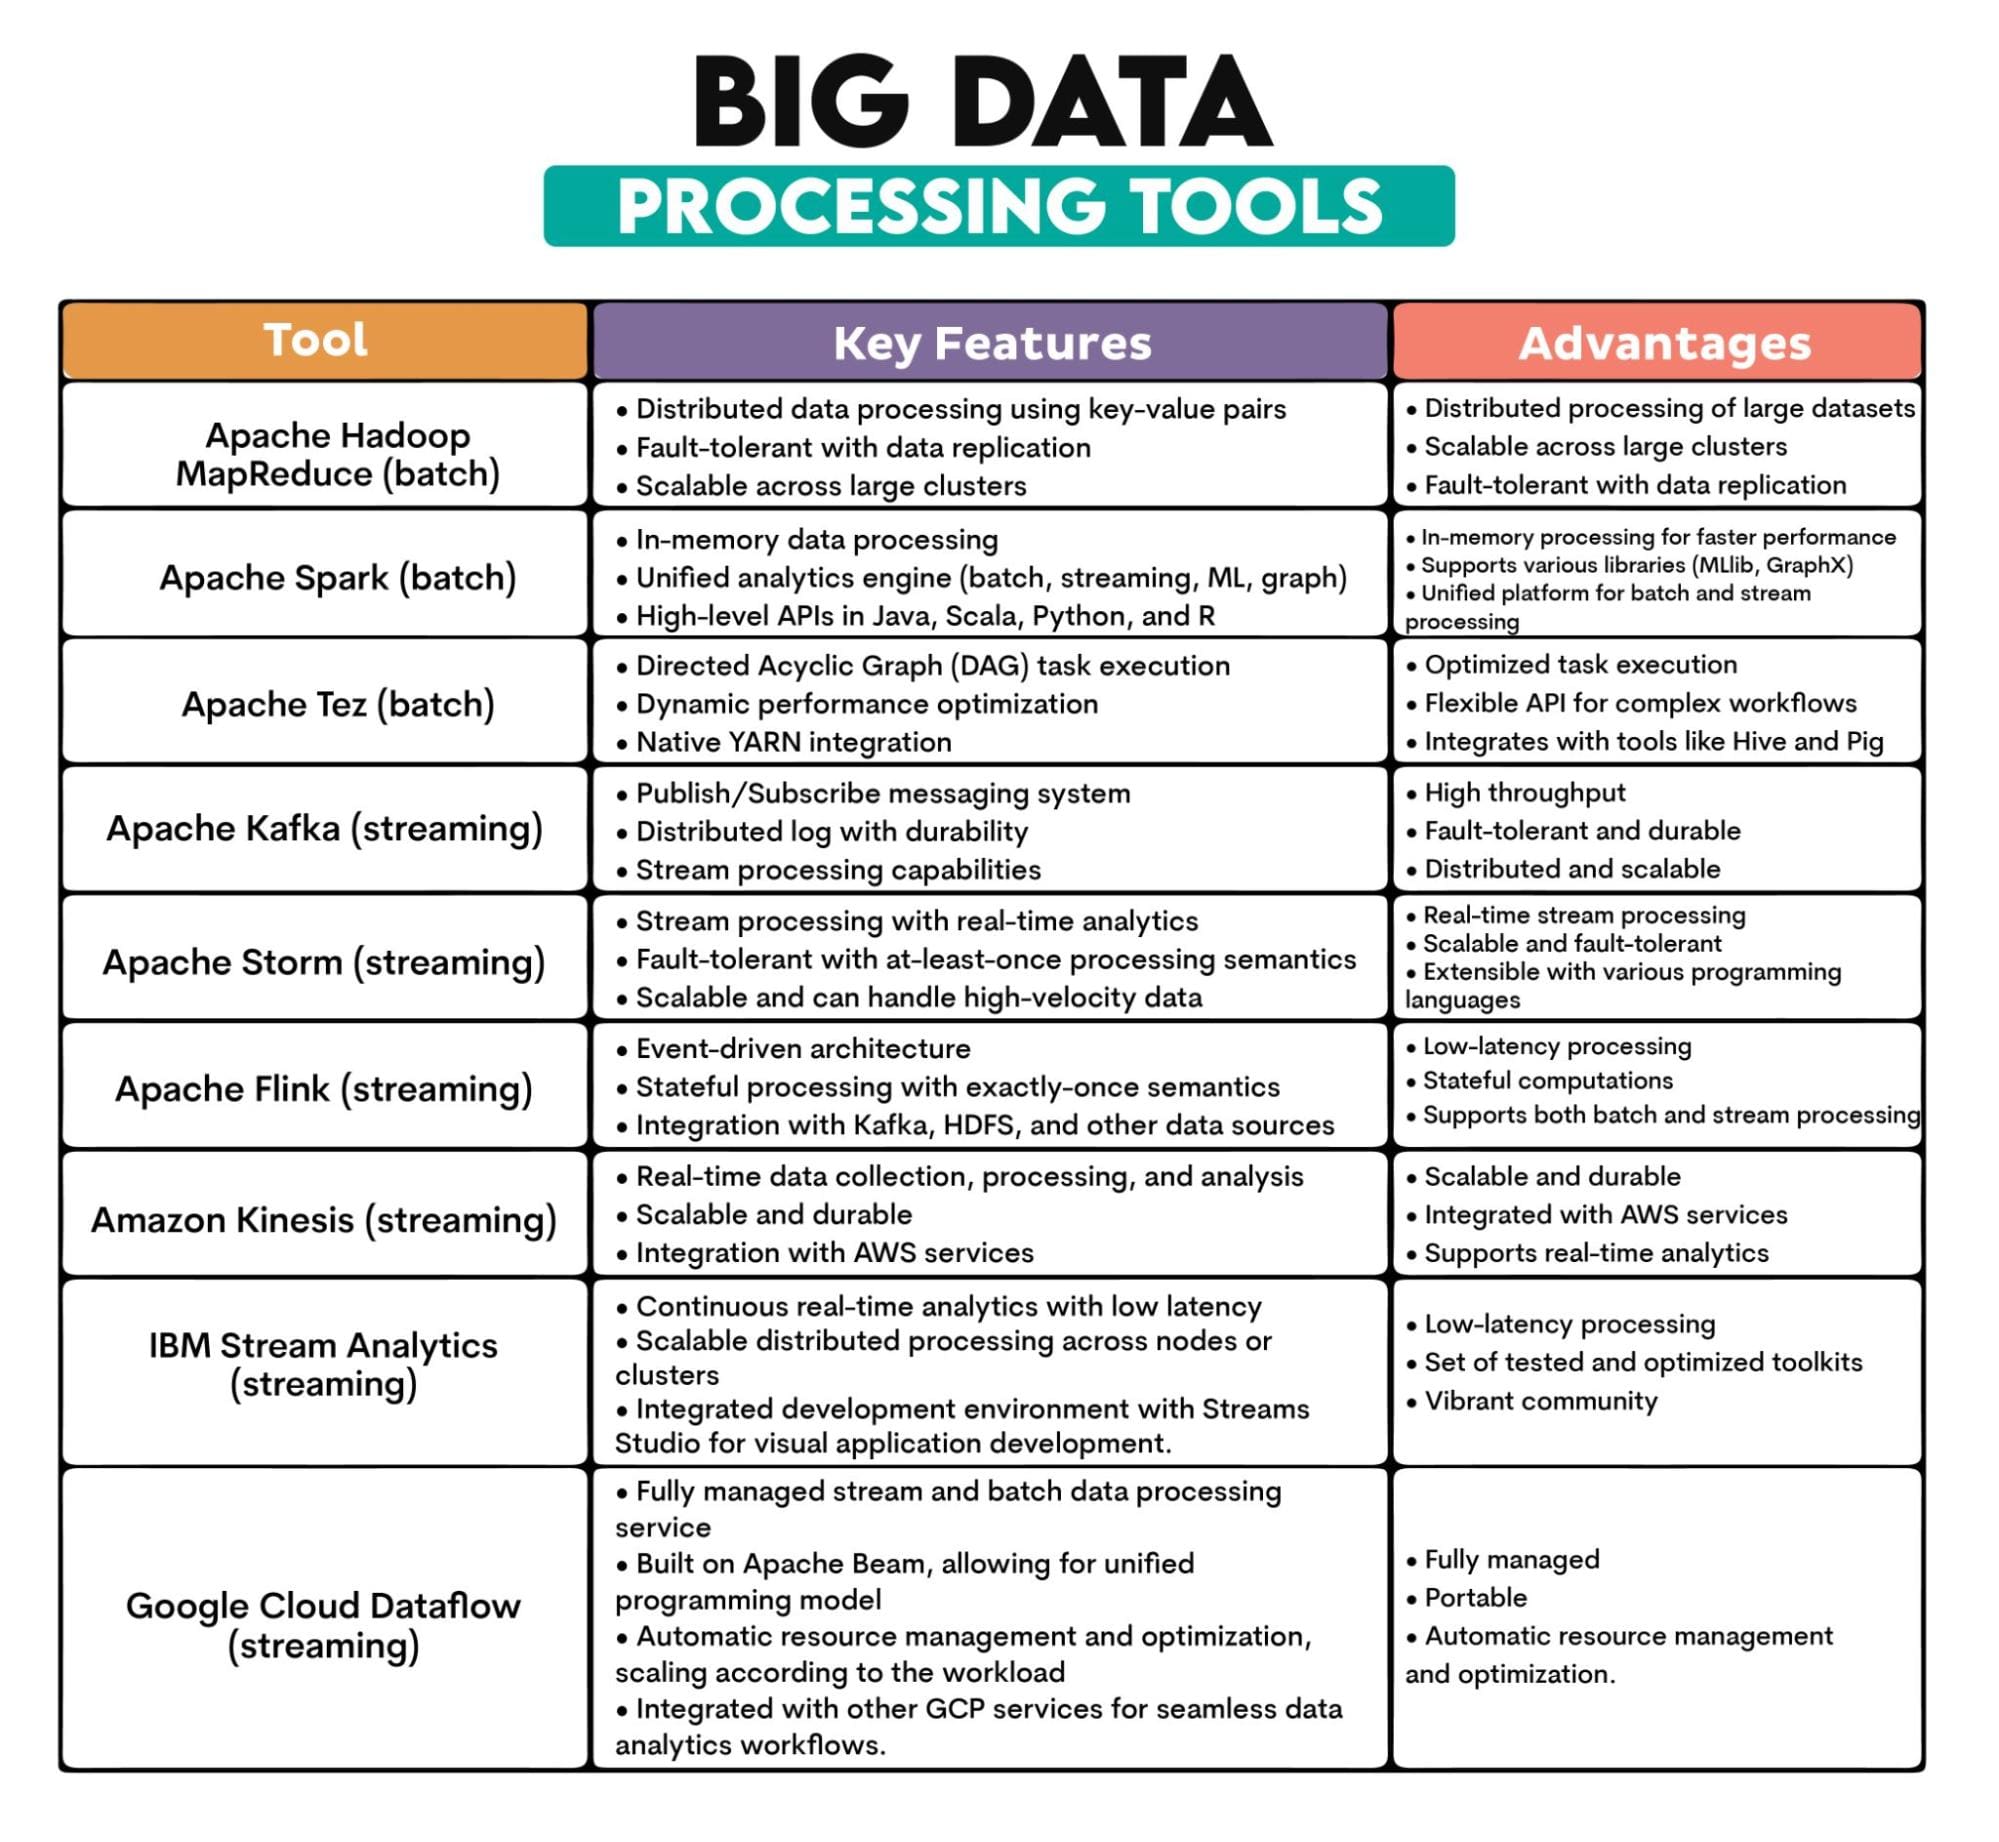
1. Big Data Processing
What is it?: Data processing refers to operations and activities that transform raw data into meaningful information. It tasks from cleaning and structuring data to running complex algorithms and analytics.
Big data is sometimes batch processed, but more prevalent is data streaming.
Key Characteristics:
- Parallel Processing: Distributing tasks across multiple nodes or servers to process data concurrently, speeding up computations.
- Real-time vs. Batch Processing: Data can be processed in real-time (as it's generated) or in batches (processing chunks of data at scheduled intervals).
- Scalability: Big data tools handle vast data by scaling out, adding more resources or nodes.
- Fault Tolerance: If the node fails, the systems will continue processing, ensuring data integrity and availability.
- Diverse Data Sources: Big data comes from many sources, be it structured databases, logs, streams, or unstructured data repositories.
Big Data Tools Used: Apache Hadoop MapReduce, Apache Spark, Apache Tez, Apache Kafka, Apache Storm, Apache Flink, Amazon Kinesis, IBM Streams, Google Cloud Dataflow
Tools Overview:
2. Big Data ETL
What is it?: ETL is Extracting data from various sources, Transforming it into a structured and usable format, and Loading it into a data storage system for analysis or other purposes.
Big data characteristics mean that the ETL process needs to handle more data from more sources. Data is usually semi-structured or unstructured, which is transformed and stored differently than structured data.
ETL in big data also usually needs to process data in real time.
Key Characteristics:
- Data Extraction: Data is retrieved from various heterogeneous sources, including databases, logs, APIs, and flat files.
- Data Transformation: Converting the extracted data into a format suitable for querying, analysis, or reporting. Involves cleaning, enriching, aggregating, and reformatting the data.
- Data Loading: Storing the transformed data into a target system, e.g., data warehouse, data lake, or database.
- Batch or Real-time: Real-time ETL processes are more prevalent in big data than batch processing.
- Data Integration: ETL integrates data from disparate sources, ensuring a unified view of data across an organization.
Big Data Tools Used: Apache NiFi, Apache Sqoop, Apache Flume, Talend
Tools Overview:
| Big Data ETL Tools | ||
| Tool | Key Features | Advantages |
| Apache NiFi | • Data flow design via a web-based UI
• Data provenance tracking • Extensible architecture with processors |
• Visual interface: Easy to design data flows
• Supports data provenance • Extensible with a wide range of processors |
| Apache Sqoop | • Bulk data transfer between Hadoop and databases
• Parallel import/export • Compression and direct import features |
• Efficient data transfer between Hadoop and relational databases
• Parallel import/export • Incremental data transfer capabilities |
| Apache Flume | • Event-driven and configurable architecture
• Reliable and durable data delivery • Native integration with Hadoop ecosystem |
• Scalable and distributed
• Fault-tolerant architecture • Extensible with custom sources, channels, and sinks. |
| Talend | • Visual design interface
• Broad connectivity to databases, apps, and more • Data quality and profiling tools |
• Wide range of connectors for various data sources
• Graphical interface for designing data integration processes • Supports data quality and master data management |
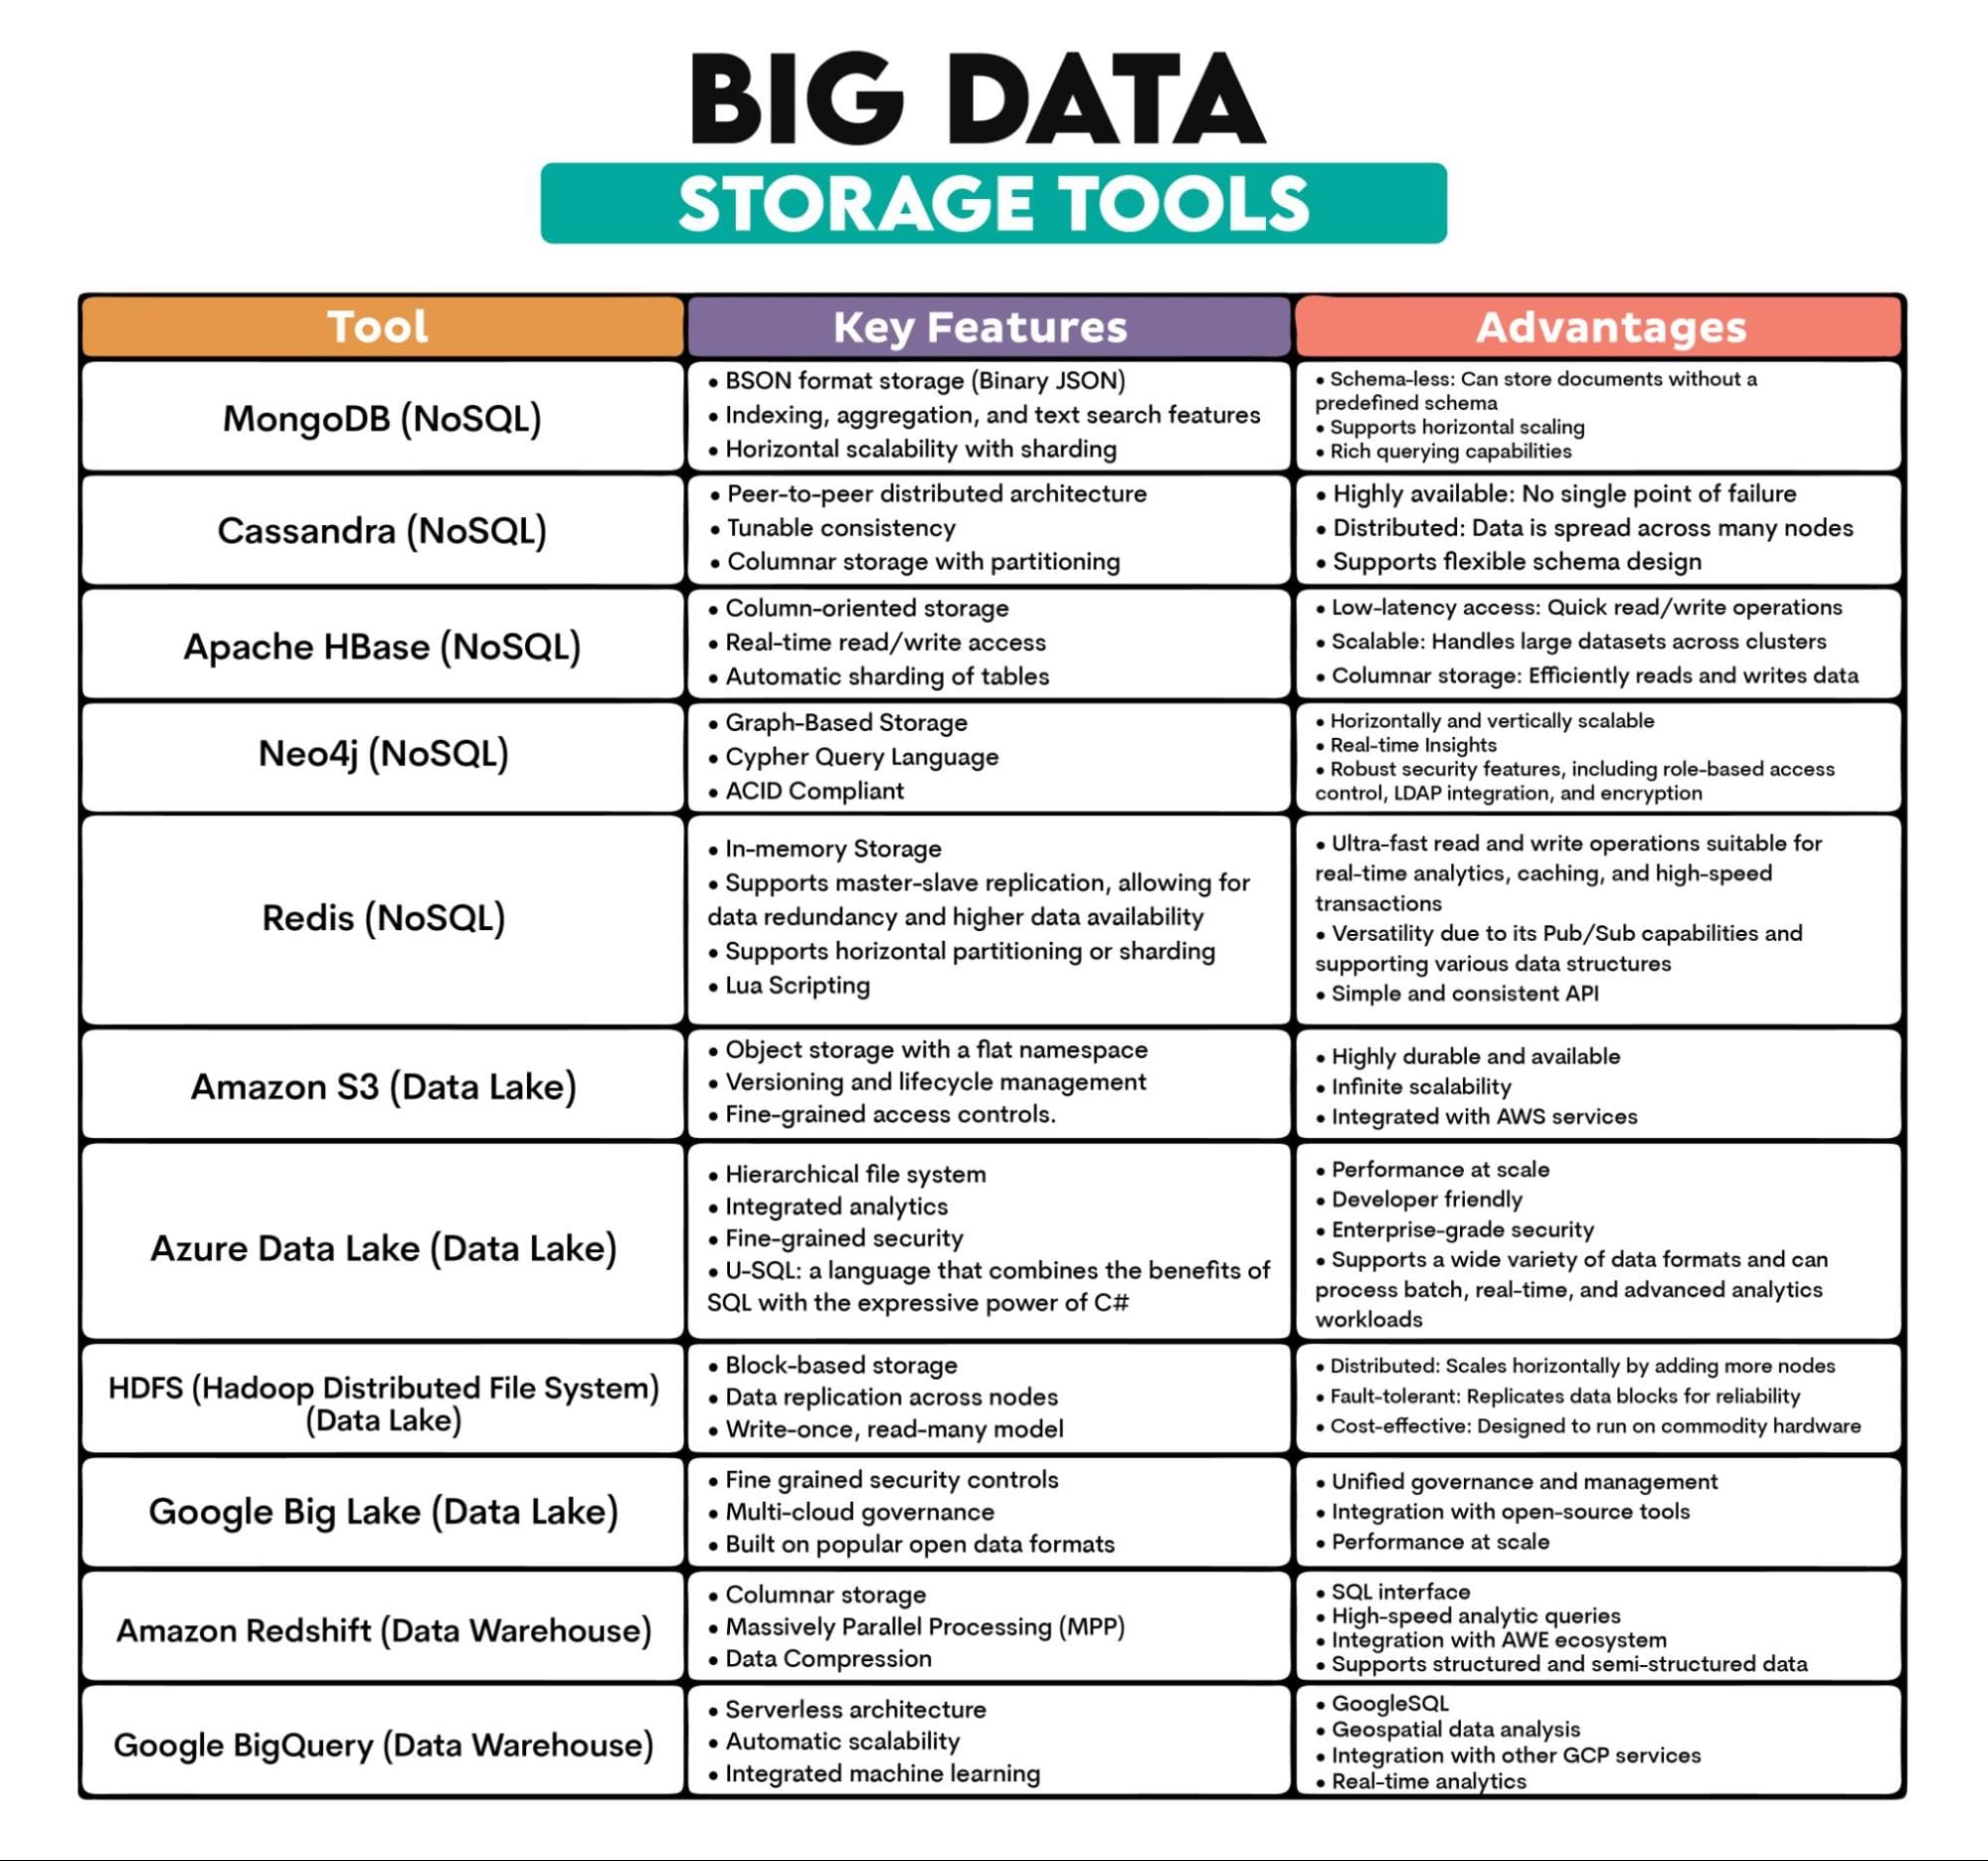
3. Big Data Storage
What is it?: Big data storage must store vast amounts of data generated at high velocities and in various formats.
The three most distinct ways to store big data are NoSQL databases, data lakes, and data warehouses.
NoSQL databases are designed for handling large volumes of structured and unstructured data without a fixed schema (NoSQL - Not Only SQL). This makes them adaptable to the evolving data structure.
Unlike traditional, vertically scalable databases, NoSQL databases are horizontally scalable, meaning they can distribute data across multiple servers. Scaling becomes easier by adding more machines to the system. They are fault-tolerant, have low latency (appreciated in applications requiring real-time data access), and are cost-efficient at scale.
Data lakes are storage repositories that store vast amounts of raw data in their native format. This simplifies data access and analytics, as all data is located in one place.
Data lakes are scalable and cost-efficient. They provide flexibility (data is ingested in its raw form, and the structure is defined when reading the data for analysis), support batch and real-time data processing, and can be integrated with data quality tools, leading to more advanced analytics and richer insights.
A data warehouse is a centralized repository optimized for analytical processing that stores data from multiple sources, transforming it into a format suitable for analysis and reporting.
It is designed to store vast amounts of data, integrate it from various sources, and allow for historical analysis since data is stored with a time dimension.
Key Characteristics:
- Scalability: Designed to scale out by adding more nodes or units.
- Distributed Architecture: Data is often stored across multiple nodes or servers, ensuring high availability and fault tolerance.
- Variety of Data Formats: Can handle structured, semi-structured, and unstructured data.
- Durability: Once stored, data remains intact and available, even in the face of hardware failures.
- Cost-Efficiency: Many big data storage solutions are designed to run on commodity hardware, making them more affordable at scale.
Big Data Tools Used: MongoDB (document-based), Cassandra (column-based), Apache HBase (column-based), Neo4j (graph-based), Redis (key-value store), Amazon S3, Azure Data Lake, Hadoop Distributed File System (HDFS), Google Big Lake, Amazon Redshift, BigQuery
Tools Overview:
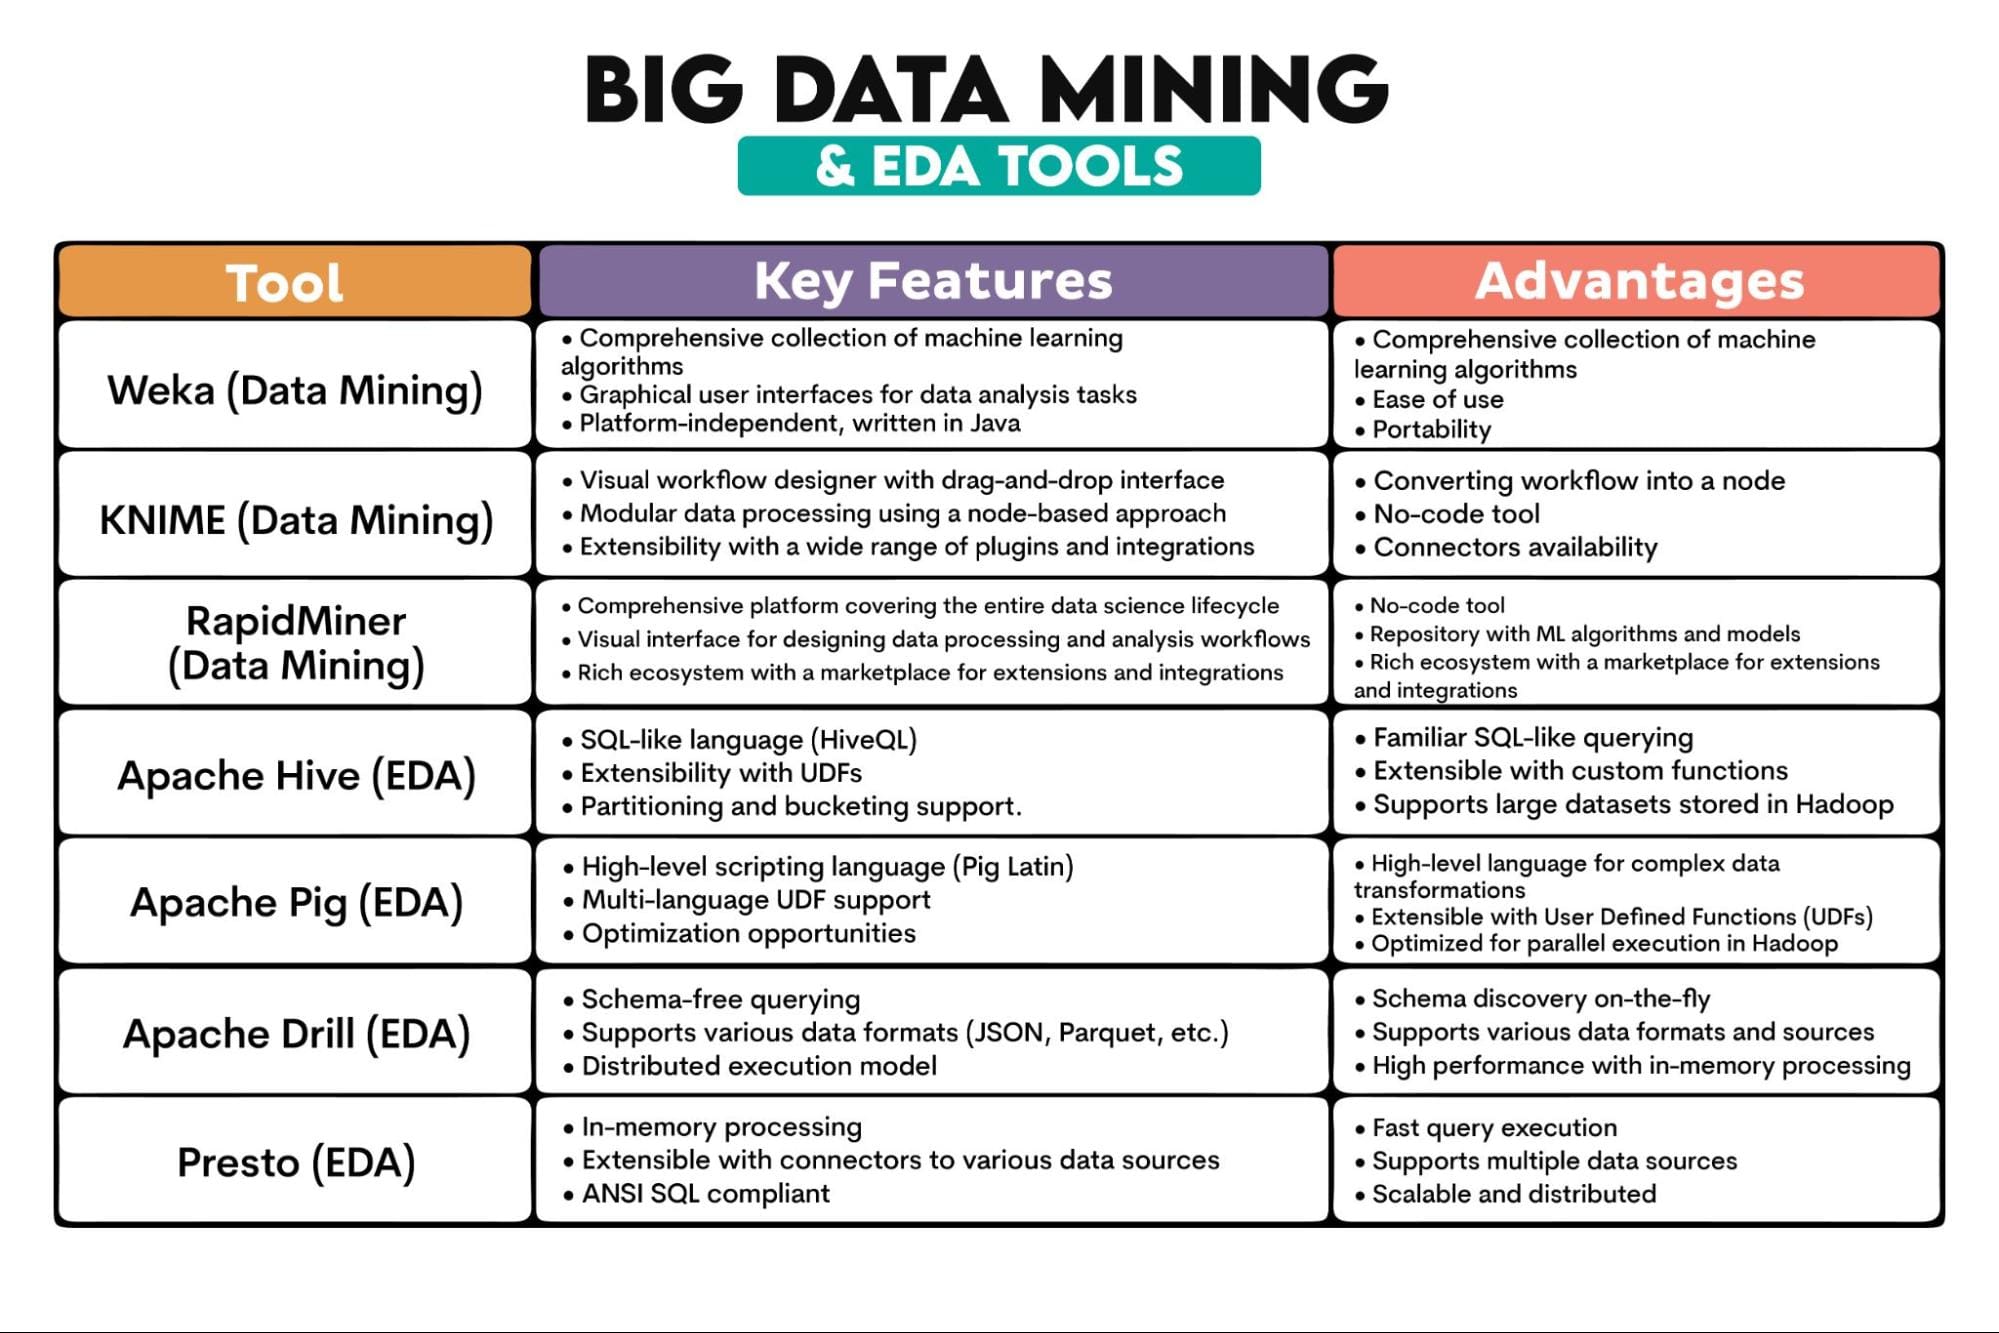
4. Big Data Mining
What is it?: It’s discovering patterns, correlations, anomalies, and statistical relationships in large datasets. It involves disciplines like machine learning, statistics, and using database systems to extract insights from data.
The amount of data mined is vast, and the sheer volume can reveal patterns that might not be apparent in smaller datasets. Big data usually comes from various sources and is often semi-structured or unstructured. This requires more sophisticated preprocessing and integration techniques. Unlike regular data, big data is usually processed in real time.
Tools used for big data mining have to handle all this. To do that, they apply distributed computing, i.e., data processing is spread across multiple computers.
Some algorithms might not be suitable for big data mining, as it requires scalable parallel processing algorithms, e.g., SVM, SGD, or Gradient Boosting.
Big data mining has also adopted Exploratory Data Analysis (EDA) techniques. EDA analyzes datasets to summarize their main characteristics, often using statistical graphics, plots, and information tables. Because of that, we’ll talk about big data mining and EDA tools together.
Key Characteristics:
- Pattern Recognition: Identifying regularities or trends in large datasets.
- Clustering and Classification: Grouping data points based on similarities or predefined criteria.
- Association Analysis: Discovering relations between variables in large databases.
- Regression Analysis: Understanding and modeling the relationship between variables.
- Anomaly Detection: Identifying unusual patterns.
Big Data Tools Used: Weka, KNIME, RapidMiner, Apache Hive, Apache Pig, Apache Drill, Presto
Tools Overview:
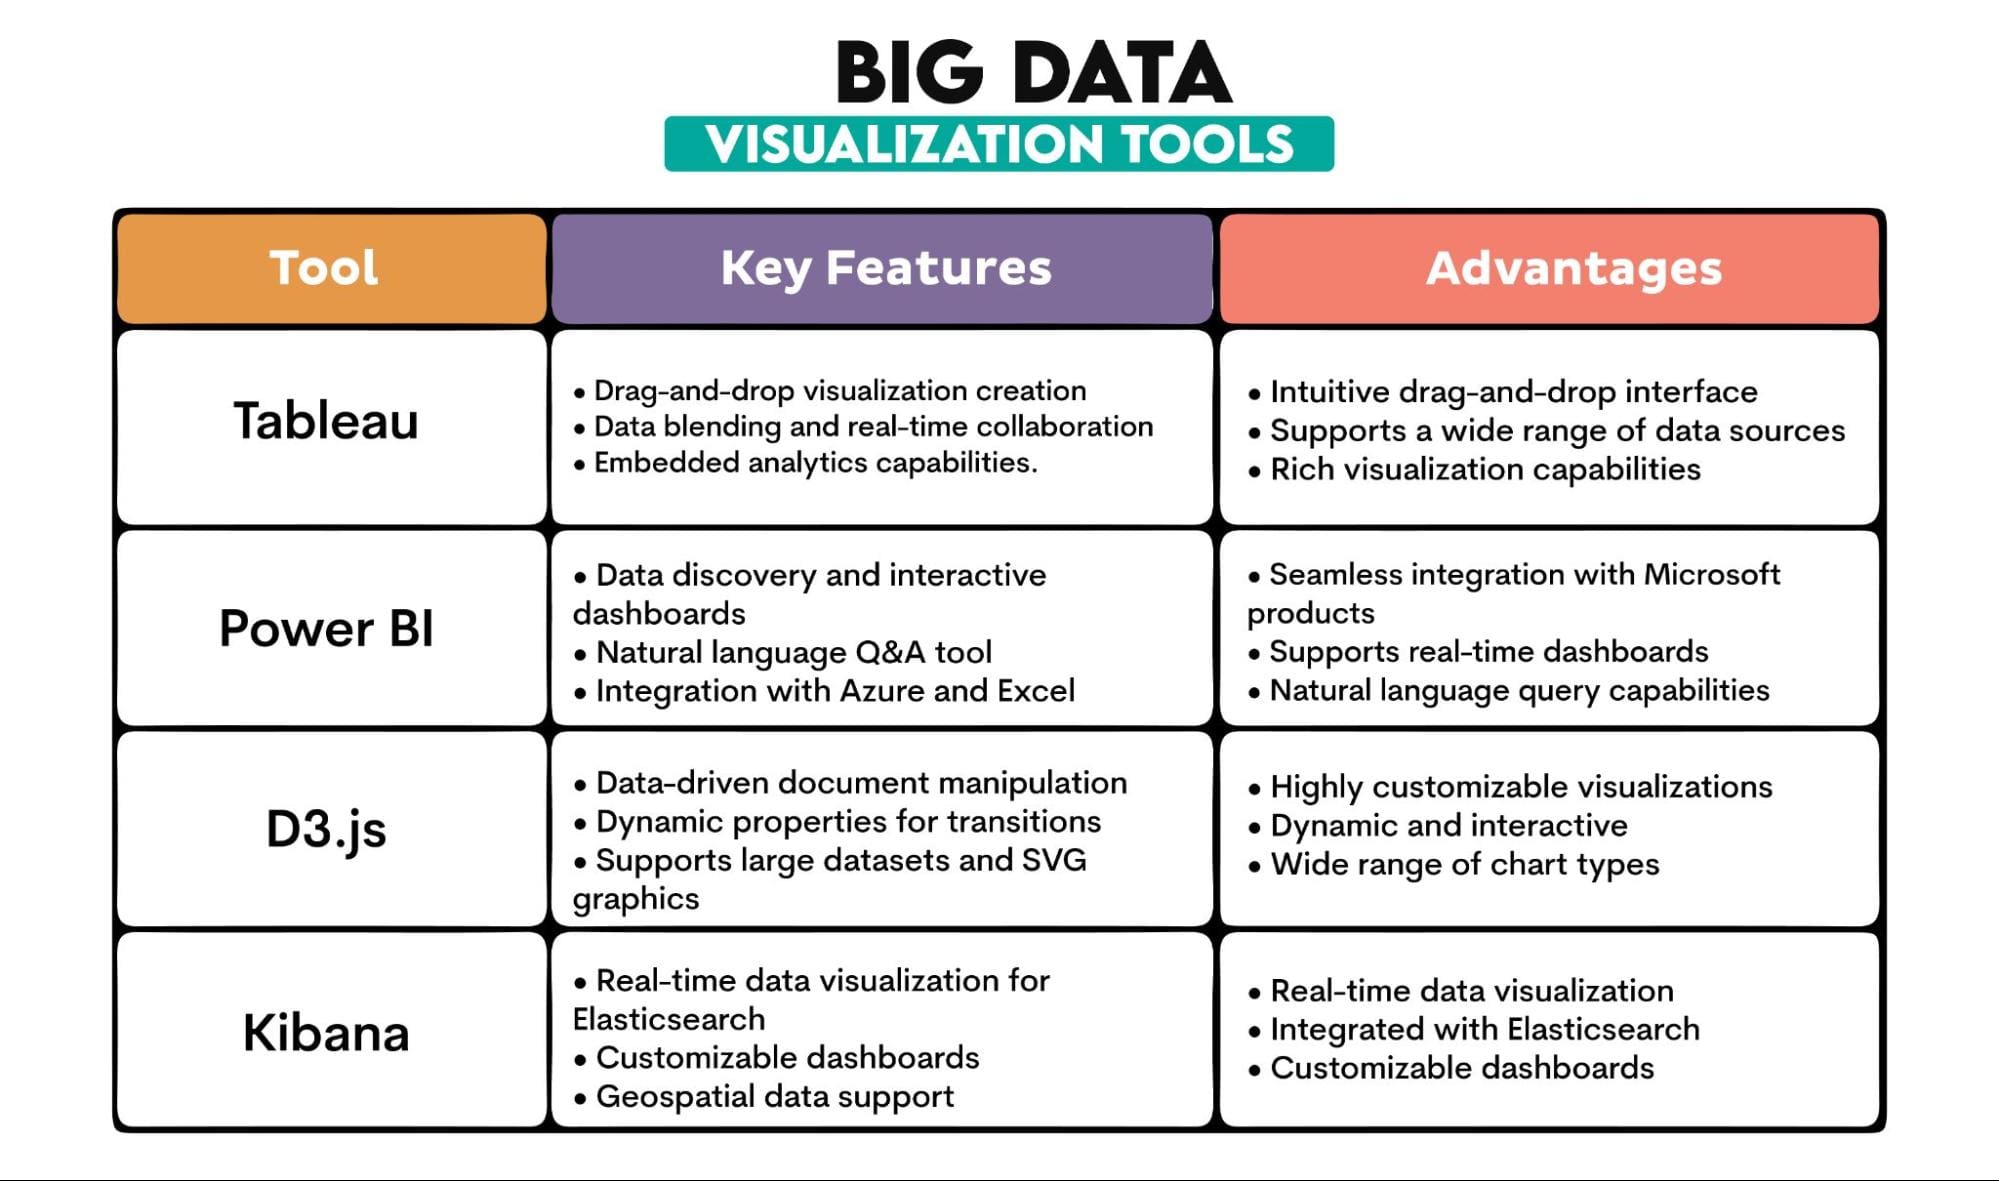
5. Big Data Visualization
What is it?: It’s a graphical representation of information and data extracted from vast datasets. Using visual elements like charts, graphs, and maps, data visualization tools provide an accessible way to understand patterns, outliers, and trends in the data.
Again, the characteristics of big data data, such as size and complexity, make it different from regular data visualization.
Key Characteristics:
- Interactivity: Big data visualization requires interactive dashboards and reports, allowing users to drill down into specifics and explore data dynamically.
- Scalability: Large datasets need to be handled efficiently without compromising performance.
- Diverse Visualization Types: E.g., heat maps, geospatial visualizations, and complex network graphs.
- Real-time Visualization: Many big data applications require real-time data streaming and visualization to monitor and react to live data.
- Integration With Big Data Platforms: Visualization tools often integrate seamlessly with big data platforms.
Big Data Tools Used: Tableau, PowerBI, D3.js, Kibana
Tools Overview:
Conclusion
Big data is so similar to regular data but also completely different. They share the techniques for handling data. But due to big data characteristics, these techniques are the same only by their name. Otherwise, they require completely different approaches and tools.
If you want to get into big data, you’ll have to use various big data tools. Our overview of these tools should be a good starting point for you.
Nate Rosidi is a data scientist and in product strategy. He's also an adjunct professor teaching analytics, and is the founder of StrataScratch, a platform helping data scientists prepare for their interviews with real interview questions from top companies. Connect with him on Twitter: StrataScratch or LinkedIn.