Product demo.
  What is data observability?
  What is a data mesh--and how not to mesh it up
  The ULTIMATE Guide To Data Lineage
 How to Conduct Data Quality Audits: A Step-by-Step Guide

Lindsay MacDonald
Lindsay is a Content Marketing Manager at Monte Carlo.
Data quality audits are a key way to ensure your business decisions are being informed by fresh, accurate, and up-to-date data.
Data quality audits can help data teams:
- Identify mistakes: Check for anomalies and discrepancies in data to check how trustworthy it is
- Understand your data better: Get a comprehensive view of all your datasets across your distributed systems
- Leverage your data for more impact: Turn your deeper data understanding into better insights for your business stakeholders
It can seem like a daunting task to perform a data quality audit. But, whether your data resides in a warehouse, lake, lakehouse, or on-prem, it’s important to take the time to assess the accuracy of your organization’s data. Without routine data quality audits, your business runs the risk of making misinformed – and consequential – decisions.
Table of Contents
What are Data Quality Audits?
A data quality audit is a step-by-step process to validate the accuracy and trustworthiness of your data. Data quality audits are meant to ensure the data fueling your business decisions is high-quality. If your data quality is lacking or inaccurate across certain points of your data pipeline, you can pinpoint, triage, and resolve those inaccuracies quickly and efficiently.
Data quality audits typically include three steps: establishing key metrics and standards, collecting and analyzing the data, and identifying and documenting data quality issues.
Planning Your Data Quality Audit
Before getting started with a data quality audit, it’s crucial to establish a clear understanding of the reasons for the audit and the scope of the data you plan to audit.
Set Clear Objectives for the Audit
Defining what you aim to achieve with a data quality audit will help your team communicate the value of the audit to your business stakeholders and members of the leadership team. It will also help team members performing the audit to understand why its important for the organization.
Especially if members of your data team need to allocate their time toward performing an audit in place of their typical work, you need to ensure that the objectives and value of this decision are clearly communicated.
Choose the Right Data to Audit
Your organization may want to audit your entire arsenal of data, or you may select a few datasets to audit individually. Choose the right datasets and clearly communicate to the responsible parties why the audit is being performed. Ensure you have access to the entire dataset, especially if data is distributed across multiple systems.
One of the best ways to manage data quality across your different datasets is to categorize the data in three ways:
- Analytical: Data is used primarily for decision making or evaluating the effectiveness of different business tactics via a BI dashboard.
- Operational: Data used directly in support of business operations in near-real time. This is typically steaming or microbatched data. Some use cases here could be accommodating customers as part of a support/service motion or an ecommerce machine learning algorithm that recommends, “other products you might like.”
- Customer facing: Data that is surfaced within and adds value to the product offering or data that IS the product. This could be a reporting suite within a digital advertising platform for example.
Then, your data team can determine which of these use cases the data quality audit should focus on.
The Data Quality Audit Process
Once you’ve adequately planned your data quality audit by setting clear objectives and choosing the data you want to assess, you’re ready to begin the data quality audit process.
There are three key steps to follow when conducting a data quality audit: establishing data quality metrics and standards, collecting and analyzing the data, and identifying and documenting data quality issues.
Let’s dive into each step of the data quality audit process.
Establish Data Quality Key Metrics and Standards
There are several metrics to consider when assessing data quality. Depending on the specific requirements of your organization, you may prioritize additional metrics, but we recommend that data teams at least start with the following data quality metrics:
- Number of incidents (N)
- Time to detection (TTD)
- Time to resolution (TTR)
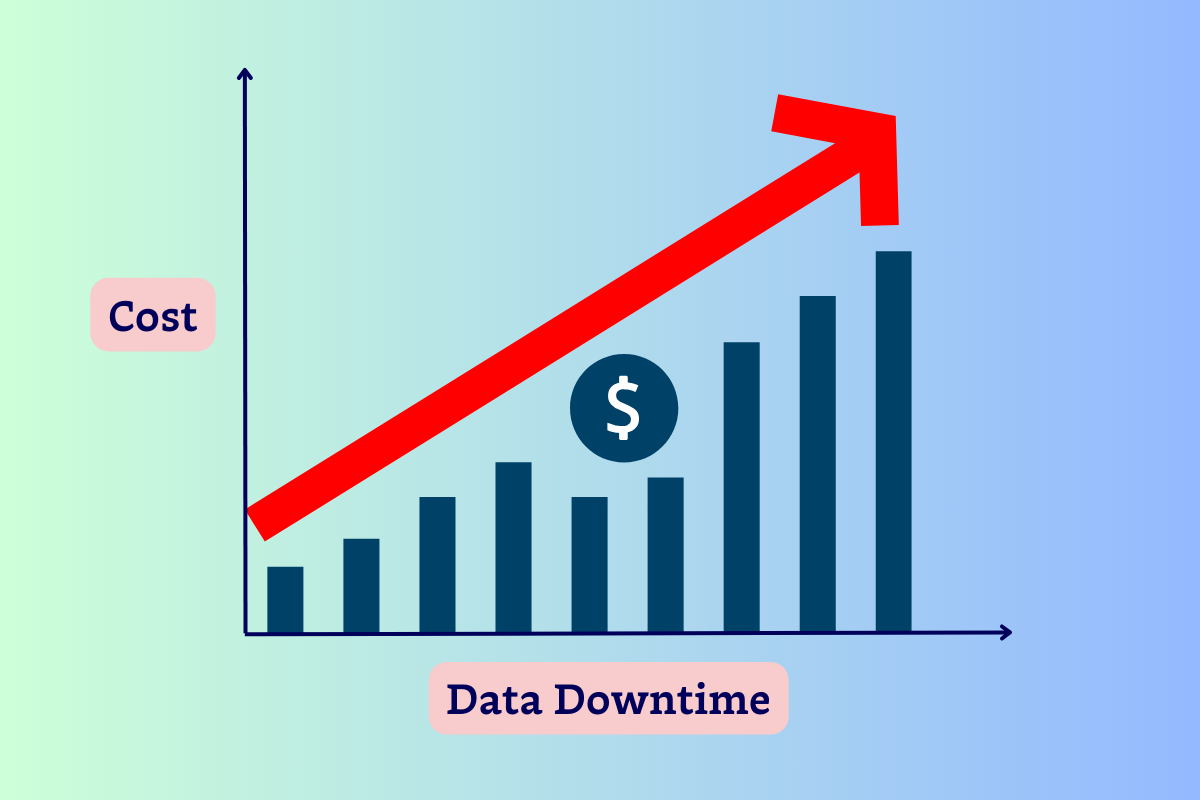
Teams typically experience at least 6 data quality incidents per table per month, and it takes, on average, 4 hours to detect those data incidents and 9 hours to resolve them. These incidents are a part of data downtime, or the period of time when data is erroneous, missing, or inaccurate. The formula for calculating data downtime looks like:
N = (TTD + TTR)
On average, data teams experience over 793 hours of data downtime per month. That’s why conducting a data quality audit is so essential. Reducing data downtime improves engineer efficiency and mitigates the risk of severe data incidents with devastating consequences.
For more data quality metrics to consider in your data quality audit, check out our cheat sheet.
Data Collection and Analysis
Once you know which data quality metrics to measure, you’ll need to gather the data to perform your analysis.
Understand where your data is stored,
- Steps for gathering and analyzing dat
Identify and Document Data Quality Issues
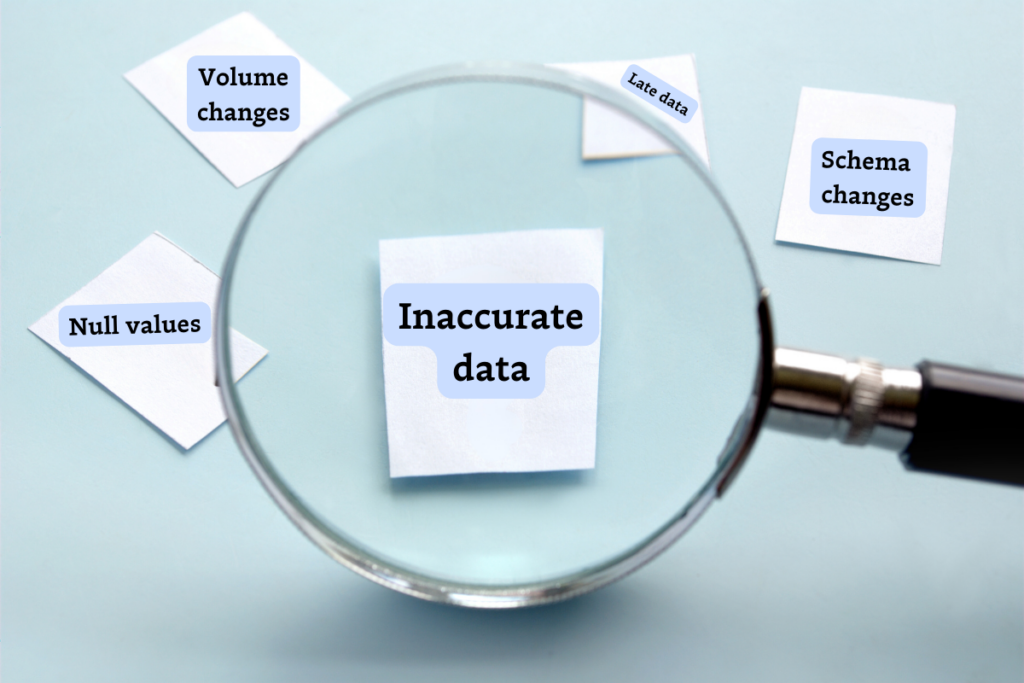
Identifying data quality issues in the data you’ve collected is key. There are many ways for data quality issues to arise, but here are some of the most common data quality issues that appear in a data quality audit:
- NULL values: a field that has been left blank either intentionally or through a pipeline error owing to something like an API outage.
- Schema changes: a broken pipeline caused by an upstream schema change.
- Volume issues: how much data is entering your pipelines? Is it more than expected? Less? When these numbers fall outside your expected range, it’s considered a volume issue.
- Distribution errors: data that skews outside an acceptable range and therefore no longer reflects reality.
- Inaccurate data: anytime data is incorrectly represented. Inaccurate data could be as simple as an SDR adding an extra zero to a revenue number or a doctor incorrectly typing a patient’s weight.
- Duplicate data: any data record that’s been copied and shared into another data record in your database.
- Relational issues: sometimes referred to as referential integrity, this problem connotes issues that exist between parent-child table relationships in a database.
- Typing errors: the most human of data downtime issues—typing errors. In a distributed professional landscape, the opportunity for little typing errors to make their way into your pipelines is virtually unlimited.
- Late data: data that hasn’t refreshed on time and is therefore no longer accurate for downstream users.
Once you’ve pinpointed these issues, you need to ensure you record them in a clear and consistent manner. Make sure you identify where in your data lineage these issues occurred.
Data Quality Audit Example
Consider a situation where your analytics/BI, data science, data engineering and product engineering teams are spending time on firefighting, debugging and fixing data issues rather than making progress on other priorities. This can include time wasted on communication (“Which team in the organization is responsible for fixing this issue?”), accountability (“Who owns this pipeline or dashboard?”), troubleshooting (“Which specific table or field is corrupt?”), or efficiency (“What has already been done here? Am I repeating someone else’s work?”).
Conducting a data quality audit can help remediate these issues. Identify the responsible team and the pipelines they own, perform an audit of their entire dataset, and learn where the data quality issues are arising. From there, you can not only triage and resolve the problems, but you have a clearer understanding of where the data downtime seems to be occurring, saving other teams the time and resources they had been spending firefighting and fixing issues.
Post-Data Quality Audit Actions
Develop a Remediation Plan
Once you’ve completed your data quality audit, you need to make sure you identify the following information
- What tables were impacted
- How many downstream users were impacted
- How critical the pipeline or table in question is to a given stakeholder
- When the impacted tables will be needed next
This information requires a deep understanding of your data pipelines, and it can help the responsible stakeholders to address the data quality issues and start the triage process quickly and effectively.
Implement Improvements and Monitor Continuously
Use the insights you gather in your data quality audit to maintain a clearer understanding of your data lineage. It’s essential to know where your data came from and where it’s going via your data pipelines to assess the blast radius of the incident, and to pinpoint the root cause to accelerate resolution.
This understanding of your data pipelines requires continuous data monitoring – and that’s where data observability can help.
Enhance Data Quality Audits with Monte Carlo
A data observability tool is a great way to monitor data quality at scale. Rather than having to perform manual query tests over and over again, automated data observability helps data teams get end-to-end coverage across their entire data pipeline.
Monte Calro also offers automated machine learning data quality checks for some of the most common data quality issues—like freshness, volume, and schema changes. This helps to streamline the data quality audit process and quickly pinpoint RCA.
If your team is ready to automate the data quality audit process, talk to our team to see how data observability can take your data quality to the next level.
Our promise: we will show you the product.
Read more posts.