Considering accessibility early and throughout the development process is key to achieving the most accessible outcome and reducing barriers for people with disabilities. When starting a project in any application throughout the ArcGIS system, accessibility should be considered at the beginning of the development process. Designing and testing for accessibility both early in the authoring process and through out the development cycle provides an inclusive experience for all.
Designing for accessibility
The most important steps in designing for accessibility are:
- Design with purpose in mind
- Consider the audience of the map or app
- Plan ahead for the data or content that will be used

Design with purpose in mind
Maps can be considered a type of data visualization, and when starting to design a data visualization, it is important to decide what is the question the data should answer or what is the purpose of the map or app.
- What is the focus of the data and what is being communicated?
- What is the goal of the map or app?
- What do users need to learn from it?
By addressing these questions, a map author can get ideas about where accessibility is needed and organize data to ensure it is communicated effectively. For example, if the goal of the map is to showcase data on population for the purpose of determining where to locate specific types of retail, a granular view of the data at the neighborhood level might be more beneficial than viewing the data at the city level.
When starting to design the map or app, use this opportunity to list different ArcGIS applications that may work to achieve the goal of the data and review each app to help determine the format that will best communicate the data.
For more information, review the article How to Choose the Right Web App in ArcGIS Online.
Consider the audience
After considering the format of the design, define the intended audience who will be consuming the data. This could be internal stakeholders, external teams, or focused individuals, but it is important to determine who will be interacting with the data. For instance, if the map targets individuals who are not familiar with the technology or who might need additional assistance, this consideration can be included in the design to improve its accessibility and usability.
The United States Centers for Disease Control provides statistics that 1 in 4 people, or 27% of adults in the United States have some type of disability. Therefore, understanding the target audience helps to improve accessibility support for individuals to access and interpret the data.

Plan ahead
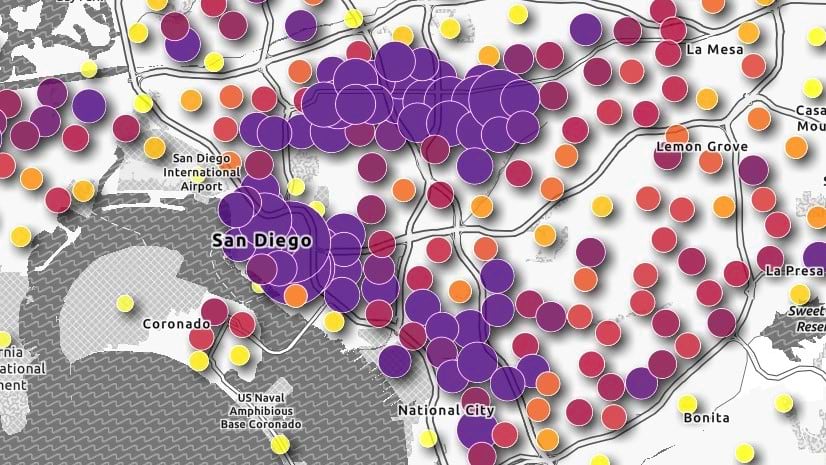
As part of the design and development process, consider the selection of data or content planned for the map or app and evaluate how to improve accessibility. Plan for various types of data and ensure that the data meets the expectations of what viewers should learn from the map. If there are multiple data sources, consider dividing the data into multiple views to support the purpose of the map. For instance, if there are too many types of symbology present, or the data is too similar in the way it is represented, it can clutter the map and make it difficult for users to understand.

Testing for accessibility
Testing for accessibility throughout the development cycle can improve accessibility in the creation of maps and apps in GIS. There are a variety of testing tools and in-browser accessibility checkers that can support testing throughout the development cycle and many of them are free. Using these tools when making color choices or working with symbology and labels can guide the process during development, rather than having to go back and correct work if testing at the end of the project.
There are three recommendations for testing processes:
- Automated testing tools
- Manual testing
- End user testing
Automated testing
Automated testing tools or “accessibility checkers” includes products that are installed as either a web browser extension or onto a computer. This type of testing supports efficient testing on web-based applications and can provide feedback to identify issues in the code. Automated testing tools are good for answering those questions that are either a “yes” or “no” logical answer and are best used to identify priority concerns.
These are some popular tools for automated accessibility testing:
- ANDI – Accessibility Testing Tool
- Axe Dev Tools
- Level Access Assistant
- WAVE – Web Accessibility Evaluation Tool
However, automated testing does not have the capability to determine if a site or application is fully accessible as many of the criteria that need to be tested require a human to fully test them. At best, automated tests may only capture 20 to 40% of all potential accessibility issues. Reliance on only automated testing can result in a false sense of security in the accessibility compliance of an app.
Manual Testing
Automated testing can be further supported by performing manual testing to provide more comprehensive details on the accessibility of an app or site. Manual testing ideally involves individuals that understand the complexity of accessibility and have a background in developer technologies. For instance, conducting manual testing on various workflows to ensure that there is a logical flow or meaning in an app will support better accessibility for users. Additionally, manual testing can include evaluating keyboard accessibility, focus order, and screen readers as well as determining if alternative text is meaningful.
End user testing
End-user testing involves individuals with different abilities and skills as well as native users of assistive technologies to best support understanding the accessibility of the map or app that is developed. This comprehensive approach to testing and development, where individuals with the lived experience can contribute to the creation of the application can more fully support a a diverse set of individuals.
The team at the City of Philadelphia worked with the US Access Board to include individuals with disabilities in end-user testing for a map created about people with disabilities in Philadelphia. Read further about Using GIS to Improve Accessibility for Philadelphians with Disabilities.
Conclusion
By considering aspects of accessibility in design and development throughout the development cycle, an interactive mapping application can be more inclusive to fit a diverse audience.
For additional information on implementing accessibility into the design of a map or app, review the article “Accessibility essentials for GIS and mapping.”


Commenting is not enabled for this article.