The fancy data stack—batch version
Data News Summer Edition — Design the fancy data stack to explore the Tour de France data.

This is the first article of the Data News Summer Edition: how to build a data platform. I tried to be as short as possible in this first article, details will come in the following ones.
The modern data stack has been criticised a lot, a few are saying it's dead other are saying we are in the post-modern era. The modern data stack as a collection of tools which interacts altogether to serve data to consumers is still relevant. Personally I think that the modern data stack characterises by having a central data storage in which everything happens.
Let's design the most complete modern data stack, or rather the fancy data stack.
In this article we will try to design the fancy data stack for a batch usage. A lot of logos and products will be mentioned. This is not a paid article. However over the years I've met people working at these companies so I might have a few biais.
As a disclaimer, this may not quite make sense in a corporate context, but since this is my blog, I'll do what I want. Still, the idea of this post is to give you an overview of existing tools and how everything fits together.
A few requirements
- The source data lies in Postgres database, in flat CSV and in Google Sheets.
- I want something cloud agnostic—when possible.
- I want to use open-source tooling.
- Everything I do should be production-ready and public. At the end of the experiment you should be able to access the tools—when possible.
Source data
When I was looking for data, I was looking for a bit of volume, something geographical and without PII. I personally like NYC Taxi trip data but sadly it has been used many times so it removes a bit the fun. At the same time the Tour de France was ongoing and I found a "way" to get Strava data for Tour athletes on Strava. So I thought it was the perfect data to build a data platform.
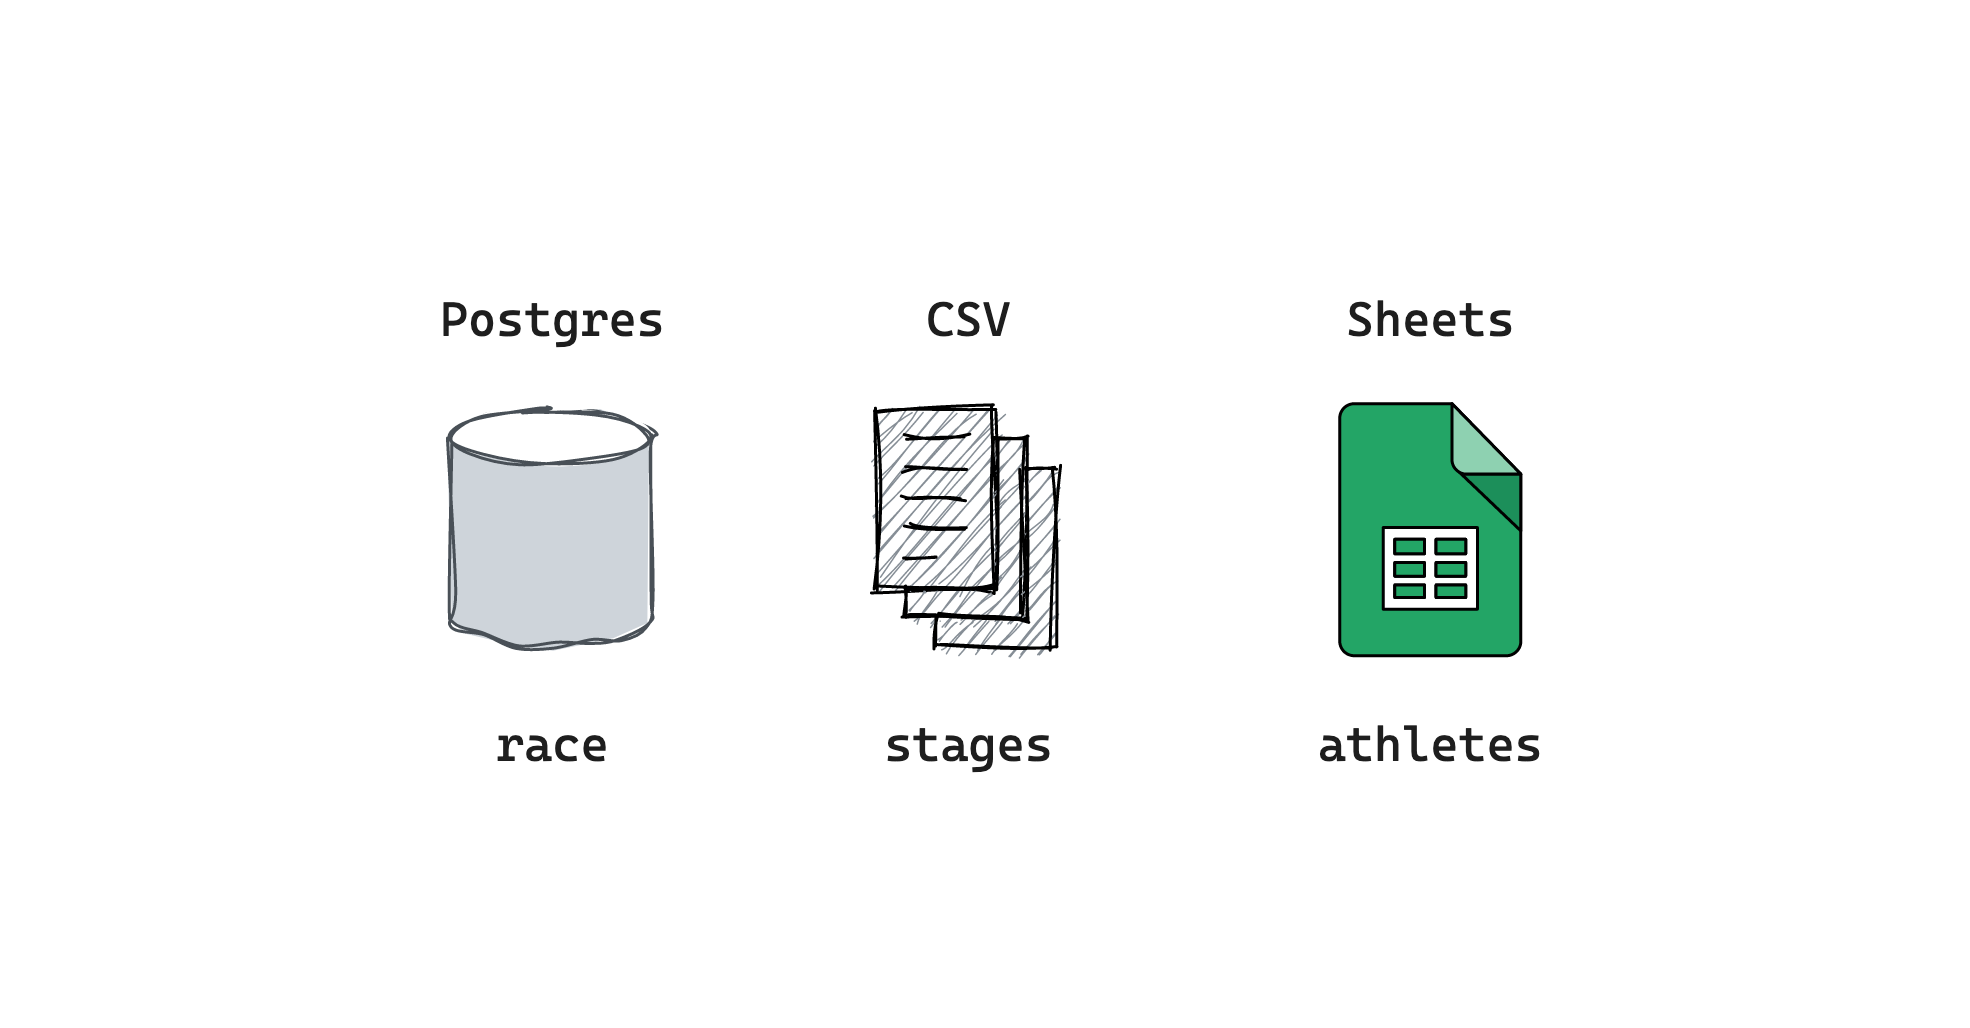
Mainly there are 3 datasets:
- Athletes — all the data about the athletes like their race ids, teams, their profile but also their body size. It will be a Google Sheets.
- Stages — le Tour de France is a 3-weeks race, it contains 21 stages, every stage is a GPS path with a few checkpoints. It will be 21 CSVs.
- Race — the actual race data which is a GPS data point every second for each athletes on Strava + other data points sometimes. It represents almost the half of the peloton. It will be a table in Postgres. Postgres is not the best solution for this, but as I want to mimic enterprise context, having a Postgres database is kinda mandatory.
Race data will be partitioned per day, but as the Tour is already done, it will be a bit different than in real life environment. Still, this is something I keep in mind for future trainings. Because I'm convinced that to learn data engineering you need to experiment real life pipelines running every day to experiment the morning firefighting.
I'll delve into the data in the next article, but I won't detail how I got the data because, you know.... 🏴☠️. Actually, it's just a few Python scripts and a bit of F12, but that's not the point of this article.
The fancy data platform
In order to have a complete data platform we will need to move the data from source to consumption. But what the consumption will look like?
I want to answer multiple use-cases:
- Create a dashboard to explore stages results
- Give a LLM driven bot that answer common questions about the race
- Compare 2 athletes performance on a specific segment and generate a GIF
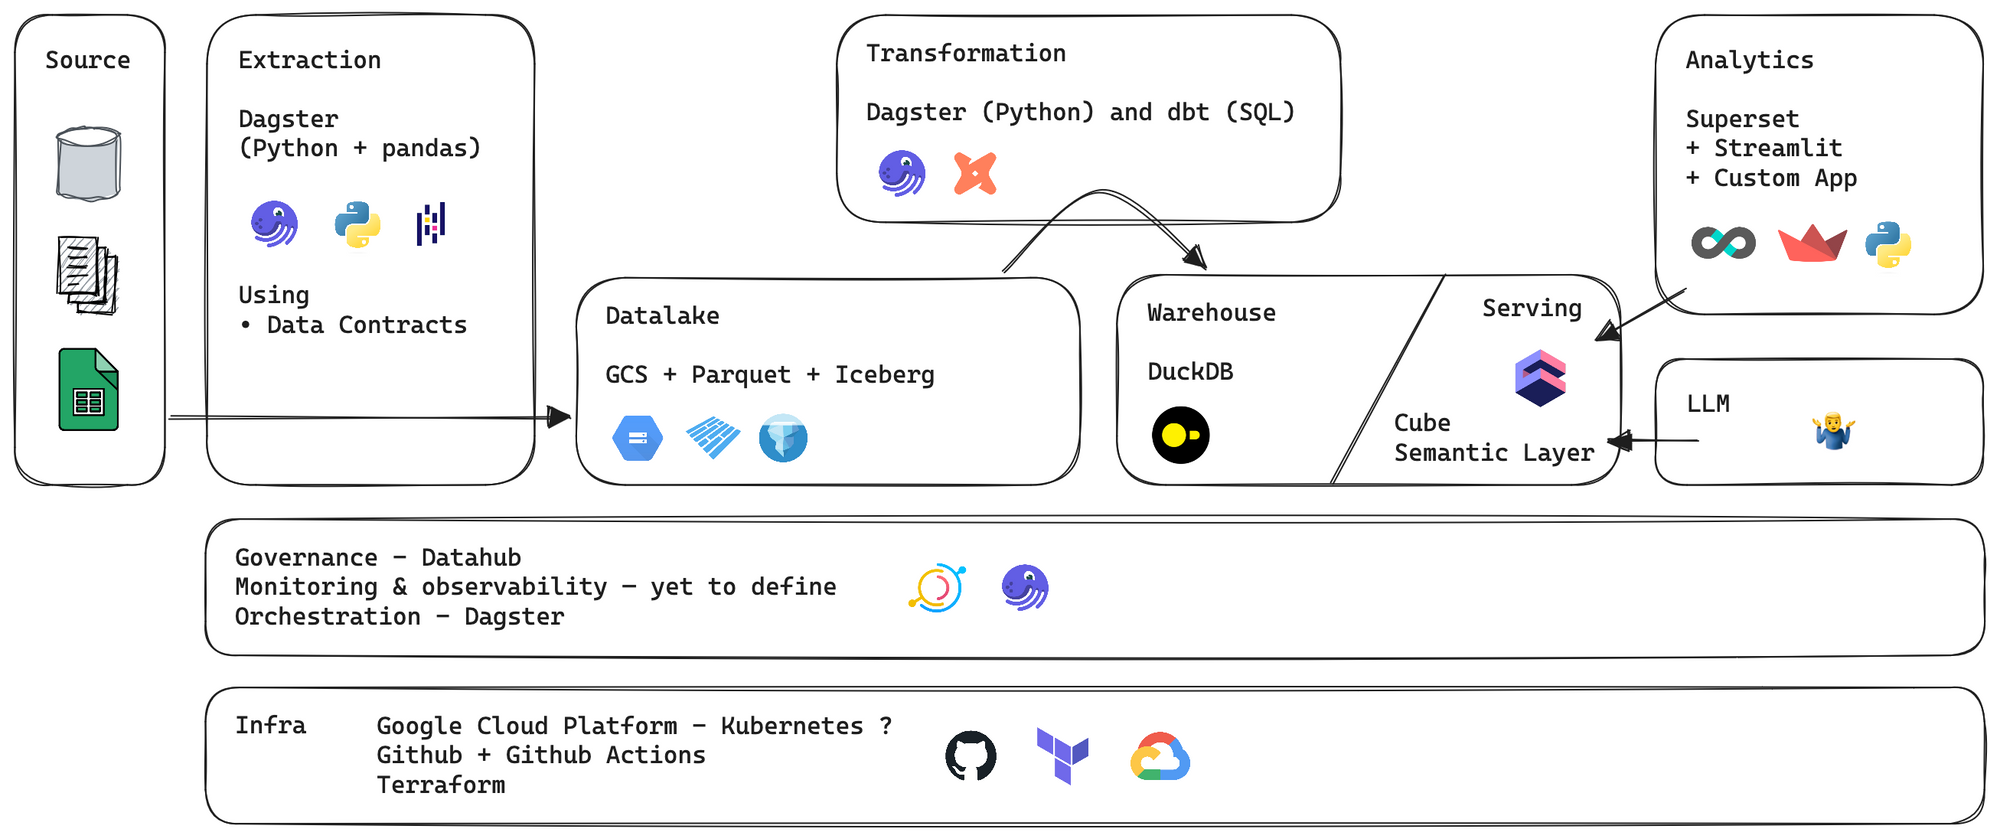
In order to answer this we will need to ingest data from the multiple sources, then transform and model the data in the chosen data storage and finally develop consumers apps to answer the business needs.
Let's try to throw a first design of our application—with logos. Obviously this can be subject to change. Either because it's too complicated either because I want to change. Once again this is fiction so I can afford to change stuff.
Actually as a one of my main advice is that you should never be strict about tech choices because you can't plan the unexpected. So do yourself a favour and accept to throw away something that does not work for you.
Just for the sake of being open, there are a lot of alternatives and my choices could have been different. Here what you can also consider if you're doing your own platform.
- Extraction
Open-source — Dagster, Airbyte, Airflow, Prefect, Mage, Kestra, dltHub
SaaS ($) — Stitch, Portable, Orchestra and the cloud versions of the OS tools
SaaS ($$) — Fivetran - Transformation
SQL — dbt, SQLMesh
Python — pandas, polars
Distributed — Spark, Pathway - Datalake
Open-source — MinIO, Ceph, LakeFS, OpenIO
SaaS ($) — S3, Google Cloud Storage, Azure Blog Storage
Table format — Apache Iceberg, Apache Hudi, Delta - Warehouse
Open-source — DuckDB, ClickHouse, Apache Pinot, Apache Kylin, Apache Doris
SaaS ($) — BigQuery, Snowflake - Semantic Layer
Open-source — Cube, Malloy, sqler
SaaS ($) — dbt Cloud, LookML - Governance
Open-source — Datahub, OpenLineage, OpenMetadata
SaaS ($) — CastorDoc, Atlan - Analytics
Open-source — Superset, Metabase, Lightdash
SaaS ($) — Tableau, Looker, PowerBI, Whaly and the cloud version of the open-source tools - Exploration
Open-source — Streamlit, Jupyter
SaaS — Hex, Graphext, Husprey, Count (etc. this list can become infinite)
Conclusion
After this design exercice I have mix feeling. I'm in between. I think this is a fancy stack because I tried to put everything inside, but as the same time is find it quite boring. Like this is just stuff that works. This is linear, I'll move data from A to B to C in to order to use it with D. Actually this is just modern data engineering.
In the following part of this series you'll follow my adventure in the extraction, the transformation and in the serving for analytics and Gen AI usage.
I hope you'll enjoy this Data News Summer Edition.
FAQ and remarks
- Why do you use Google Cloud?
Because my credit card is already in place and I'll be much faster. My opinion on the matter is this: all clouds are born equal, you just have to find the one you're most comfortable with, or suffer your company's choices. - DuckDB is not really a data warehouse.
I pick DuckDB because it's fancy. I think I'm gonna hit some limitation especially in Geo compute, so I might switch to ClickHouse or BigQuery if I lack of time. - I hate Github actions, but I prefer putting code in public in Github.
- I used the way to visualise data platform Gitlab data team is using.
- What about the performance of the platform?
I don't really care about performance, because this is not large data and I don't want to spend hour optimising for performance. - Do you have a budget?
Something reasonable. I think ~100€ / month is ok for this experience. - What will you do in LLM category?
I don't know yet. If you have ideas about what I can do reach me. - Why Dagster?
I've been building things with Airflow for almost 5 years, I love trying new things and in the list of orchestrators that have hyped me the most, Dagster is number one. Software-defined assets are something I wanted to play with.
Small Fast News ⚡️
If you want dont care about this, here a few articles you might want to read by the pool.
- How to model: Kimball vs One Big Table — This is one of the main topic of discussion in the data space. Should you go for dimensional modeling or go for OBT or even go for query-driven data modeling (coined by Joe Reis—who's writing a book about data modeling).
- Costwiz, Saving cost for LinkedIn enterprise on Azure — LinkedIn developed a complete data platform on Azure to save costs on Azure.
- Confidence — An experimentation platform from Spotify — After years of experience in building experimentations, Spotify decided to release a product for others to do it. This is in private beta and the move is interesting.
- DuckDB vs. Spark, ElasticSearch and MongoDB — Even if this is not really relevant to compare it to NoSQL databases, tests are showing that DuckDB looks better.
- Overview of JupyterHub ecosystem — Just saving this for me because I do stuff on it.
- Read Data Engineering Weekly.
See you next week ❤️.


blef.fr Newsletter
Join the newsletter to receive the latest updates in your inbox.