


The DoorDash ETA team is committed to providing an accurate and reliable estimated time of arrival (ETA) as a cornerstone DoorDash consumer experience. We want to ensure that every customer can trust our ETAs, ensuring a high-quality experience in which their food arrives on time every time.
With more than 2 billion orders annually, our dynamic engineering challenge is to improve and maintain accuracy at scale while managing a variety of conditions within diverse delivery and merchant scenarios. Here we delve into three critical focus areas aimed at accomplishing this:
- Extending our predictive capabilities across a broad spectrum of delivery types and ETA scenarios
- Harnessing our extensive data to enhance prediction accuracy
- Addressing each delivery’s variability in timing, geography, and conditions
To address these challenges, we've developed a NextGen ETA Machine Learning (ML) system, as shown in Figure 1 below. The key novelty in NextGen’s architecture is a two-layer structure which decouples the decision-making layer from the base prediction problem. The goal of the base layer is to provide unbiased accuracy-first prediction with uncertainty estimation through probabilistic predictions. Then the decision layer leverages the base model’s predictions to solve various multi-objective optimization problems for different businesses. This is an evolution from our previous ETA modeling method [1, 2] which focus more on long-tail minimization.
This harnesses state-of-the-art deep learning (DL) algorithms through a novel two-layer ML architecture that provides precise ETA predictions from vast, real-world data sets for optimal robustness and generalizability. The new system introduces:
- Multi-task modeling to predict the various types of ETAs via a single model
- Cutting-edge DL algorithms, ensuring state-of-the-art prediction accuracy
- A probabilistic base layer coupled with a distinct decision layer to quantify and communicate uncertainty

The base layer model outputs a predicted distribution to estimate expected ETA time. The decision layer leverages the base model’s predictions to solve various multi-objective optimization problems for different businesses.
Scaling ETAs Across Different Delivery Types
DoorDash's ETAs cater to various customer interaction stages and delivery types. Initially, customers can use ETAs on the home page to help them decide between restaurants and other food merchants. The features available for predicting these ETAs are limited because they are calculated before the customer has placed anything in their cart; feature latency must remain low to quickly predict ETAs for all nearby providers.
Delivery types range from a Dasher picking up prepared meals to grocery orders that require in-store shopping, which introduces distinct delivery dynamics.
Historically, this diversity required multiple specialized models, each finely tuned for specific scenarios, leading to a cumbersome array of models. While accurate, this approach proved unsustainable because of the overhead required to adapt and evolve each model separately.
The pivot to multi-task (MT) modeling addresses these challenges head-on. This approach enables us to streamline ETA predictions across different customer touchpoints and delivery types within a singular, adaptable framework.
Nowadays, MT architecture is commonly used in large-scale ML systems such as computer vision and recommendation systems. Our MT architecture consists of a shared heavyweight foundation layer, followed by a specialized lightweight task head for each prediction use case (see “Base Layer” in Figure 1 above).
The consolidated MT model offers four distinct advantages:
- We can quickly onboard new ETA prediction use cases by attaching new task heads to the foundation layer and fine-tuning the predictions for the new task.
- This model offers a seamless experience across the platform by providing consistent ETA predictions through different stages of the consumer's journey, including on the home page, store page, and checkout page. Before MT, we trained separate models for each stage, which led to discrepancies in ETA predictions across stages, negatively affecting the consumer experience.
- Using the MT model, we can fully leverage the tremendous capacity of DL models, using high-dimensional input features to capture the uncertainty in ETA.
- The MT model elegantly solves the data imbalance issue via transfer learning. At DoorDash, certain types of ETA predictions, for example Dasher delivery, are more common than others, such as consumer pick-up. If we train separate models for each use case, the infrequent ones will suffer from lower prediction accuracy. MT improves these infrequent use cases by transferring ETA patterns learned from frequent use cases. For example, MT greatly improved ETA predictions for deliveries in Australia, which previously used a separately trained model.
However, the novel MT architecture involves unique challenges. Model training is more complex because each model must simultaneously learn to predict different ETA use cases. After experimenting with different training strategies, we found that sequentially training different heads, or tasks, achieves the best overall prediction performance. Additionally, there is higher model latency in the MT architecture because of the neural network’s larger number of parameters. We address this through close collaboration with backend engineering teams.
Subscribe for weekly updates
Using Deep Learning to Enhance Accuracy
In our quest to maximize ETA prediction accuracy, we encountered a challenge with our tree-based ML models: they reached a performance plateau beyond which further model enhancements, additional features, or more training data fail to yield significant improvements. Tree-based models also could not generalize effectively to unseen or rare use cases — a common issue with these types of models.
Using tree-based models often resulted in tradeoffs that sacrificed earliness to reduce lateness, and vice versa, rather than improving on-time accuracy. To overcome this and align with our system design goals, we revamped our ETA model architecture from tree-based to neural networks that could provide more accurate, robust, and generalizable ETA prediction performance.
We plan to publish more blog posts on MT ETA model development. Here are high-level summaries of the three key areas we will address:
- Feature engineering: We integrated feature-embedding techniques to effectively encapsulate a broad spectrum of high cardinality data. This advancement has significantly refined our model's ability to discern and learn from intricate patterns unique to specific data segments.
- Enhanced model capability: Our model was augmented with advanced components pivotal in detecting both high- and low-level signals and in modeling complex interactions between features.
- Flexible optimization: We leveraged the adaptable nature of the DL optimization process to provide flexibility for our model to meet our diverse set of objectives more effectively.
Leveraging Probabilistic Models for More Accurate ETAs
DoorDash believes it is pivotal to ensure customer trust. Customers depend on our delivery time estimates to make choices between restaurants and to organize their schedules. Previously, we used machine learning to produce estimates based on analyzing past delivery data, factoring in various elements like food preparation time and Dasher availability.
However, aspects of the delivery process are inherently uncertain and involve factors we can't fully predict or control. This unpredictability can affect out accuracy. Consider these scenarios:
| Component | Unknown Factor | Potential Impact |
| Food preparation time | # of sit-down and non-DoorDash restaurant orders | Delay in food readiness |
| Dasher availability | Whether nearby Dashers will accept the order | Pickup time variability |
| Parking availability | In dense urban areas, Dashers may have trouble finding parking | Pickup and/or drop-off delays |
By factoring in these uncertainties, we aim to refine our delivery estimates, balancing accuracy with the reality of unpredictable factors. We do this by leveraging the innovative two-layer structure which employs a probabilistic prediction model as the base layer.
Consider two theoretical deliveries as shown in Figure 2 below, both with a predicted ETA of 20 minutes, but one with a larger variance and a higher chance of being either early or late.
| High Uncertainty | Low Uncertainty |
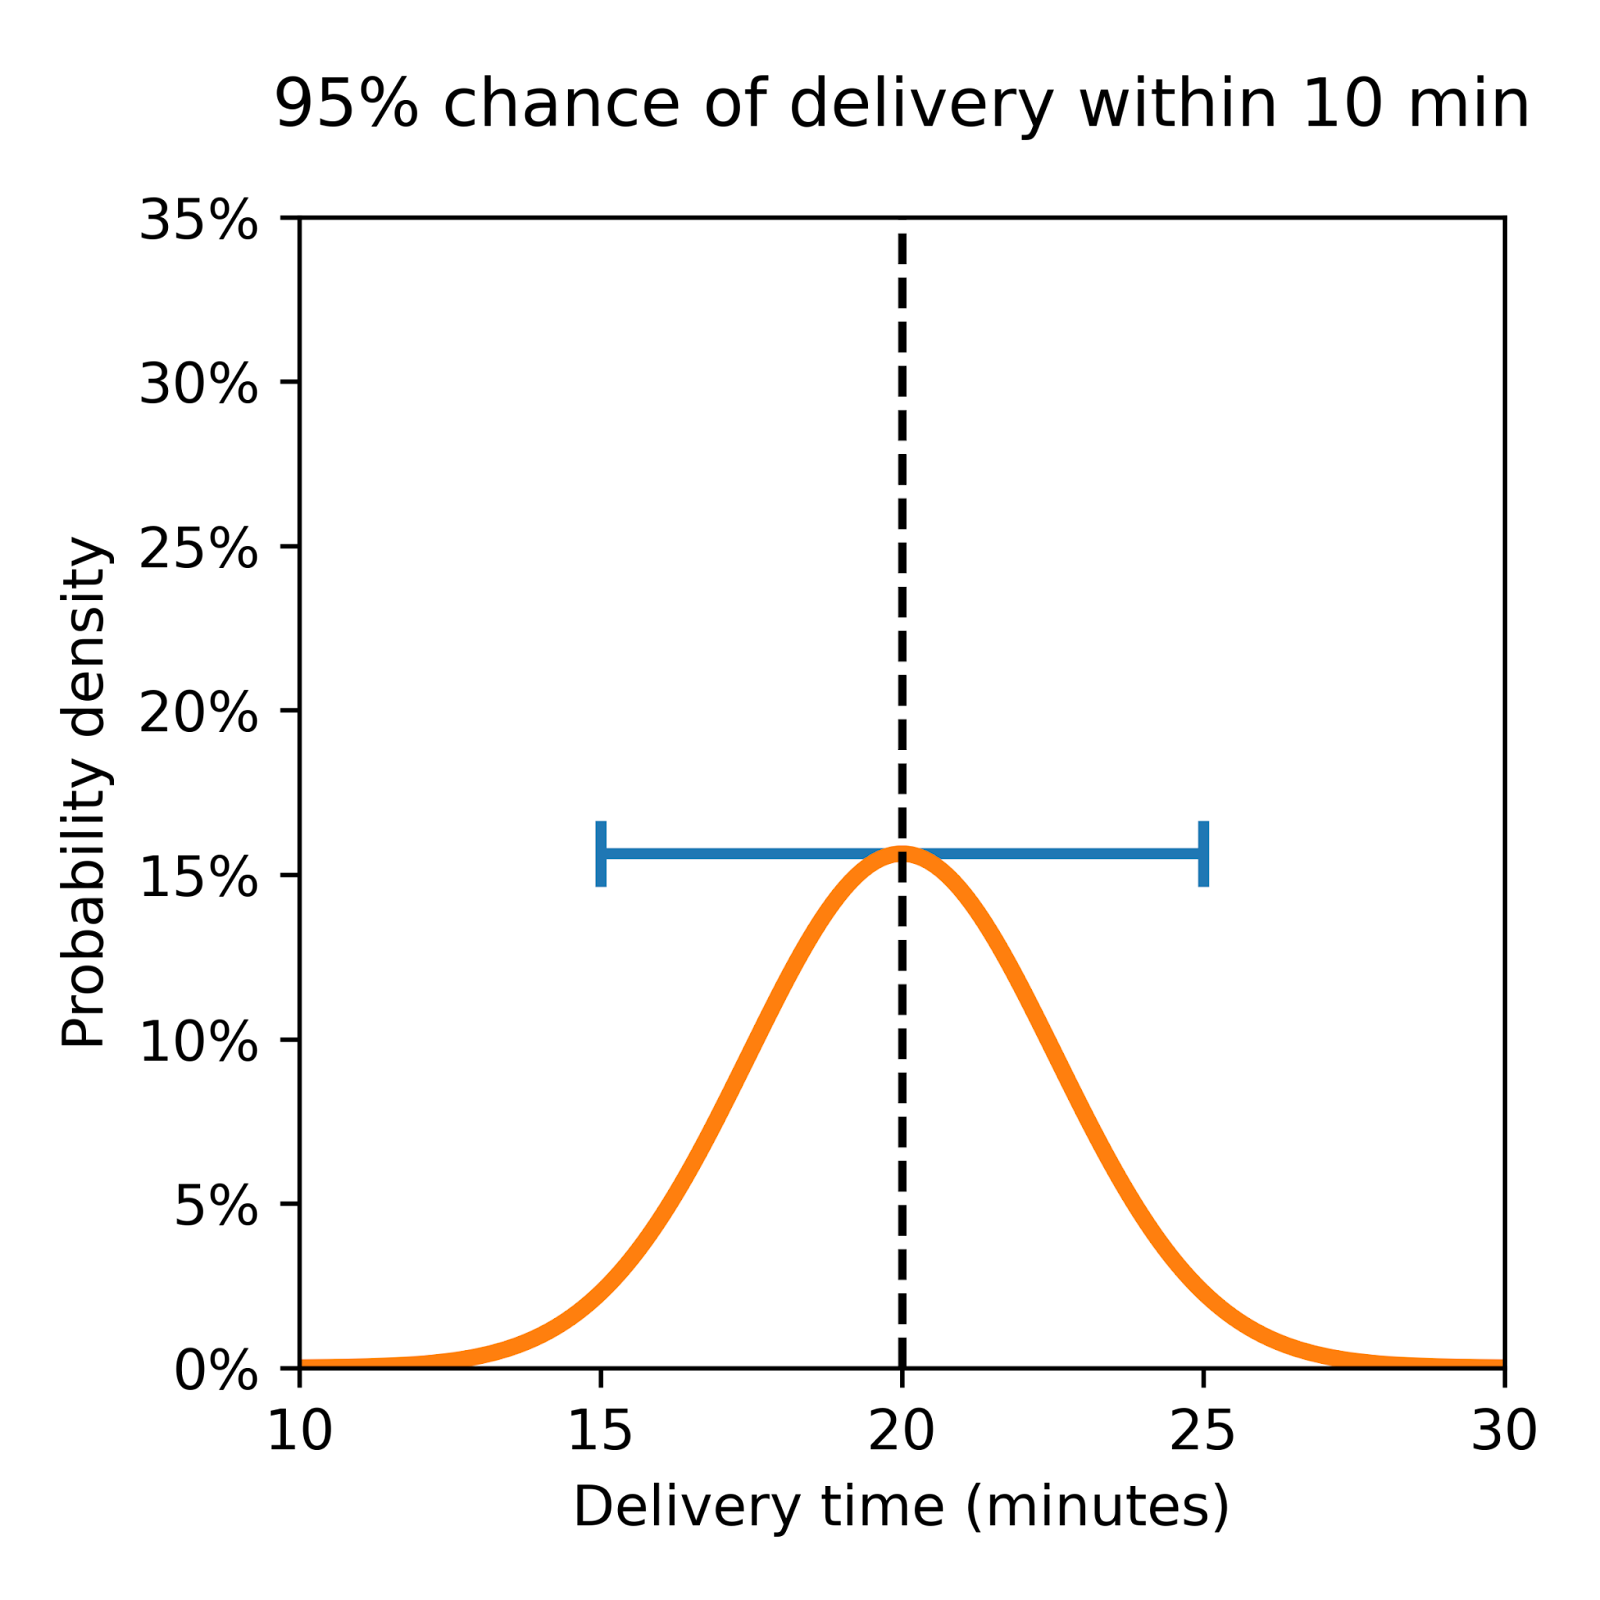 | 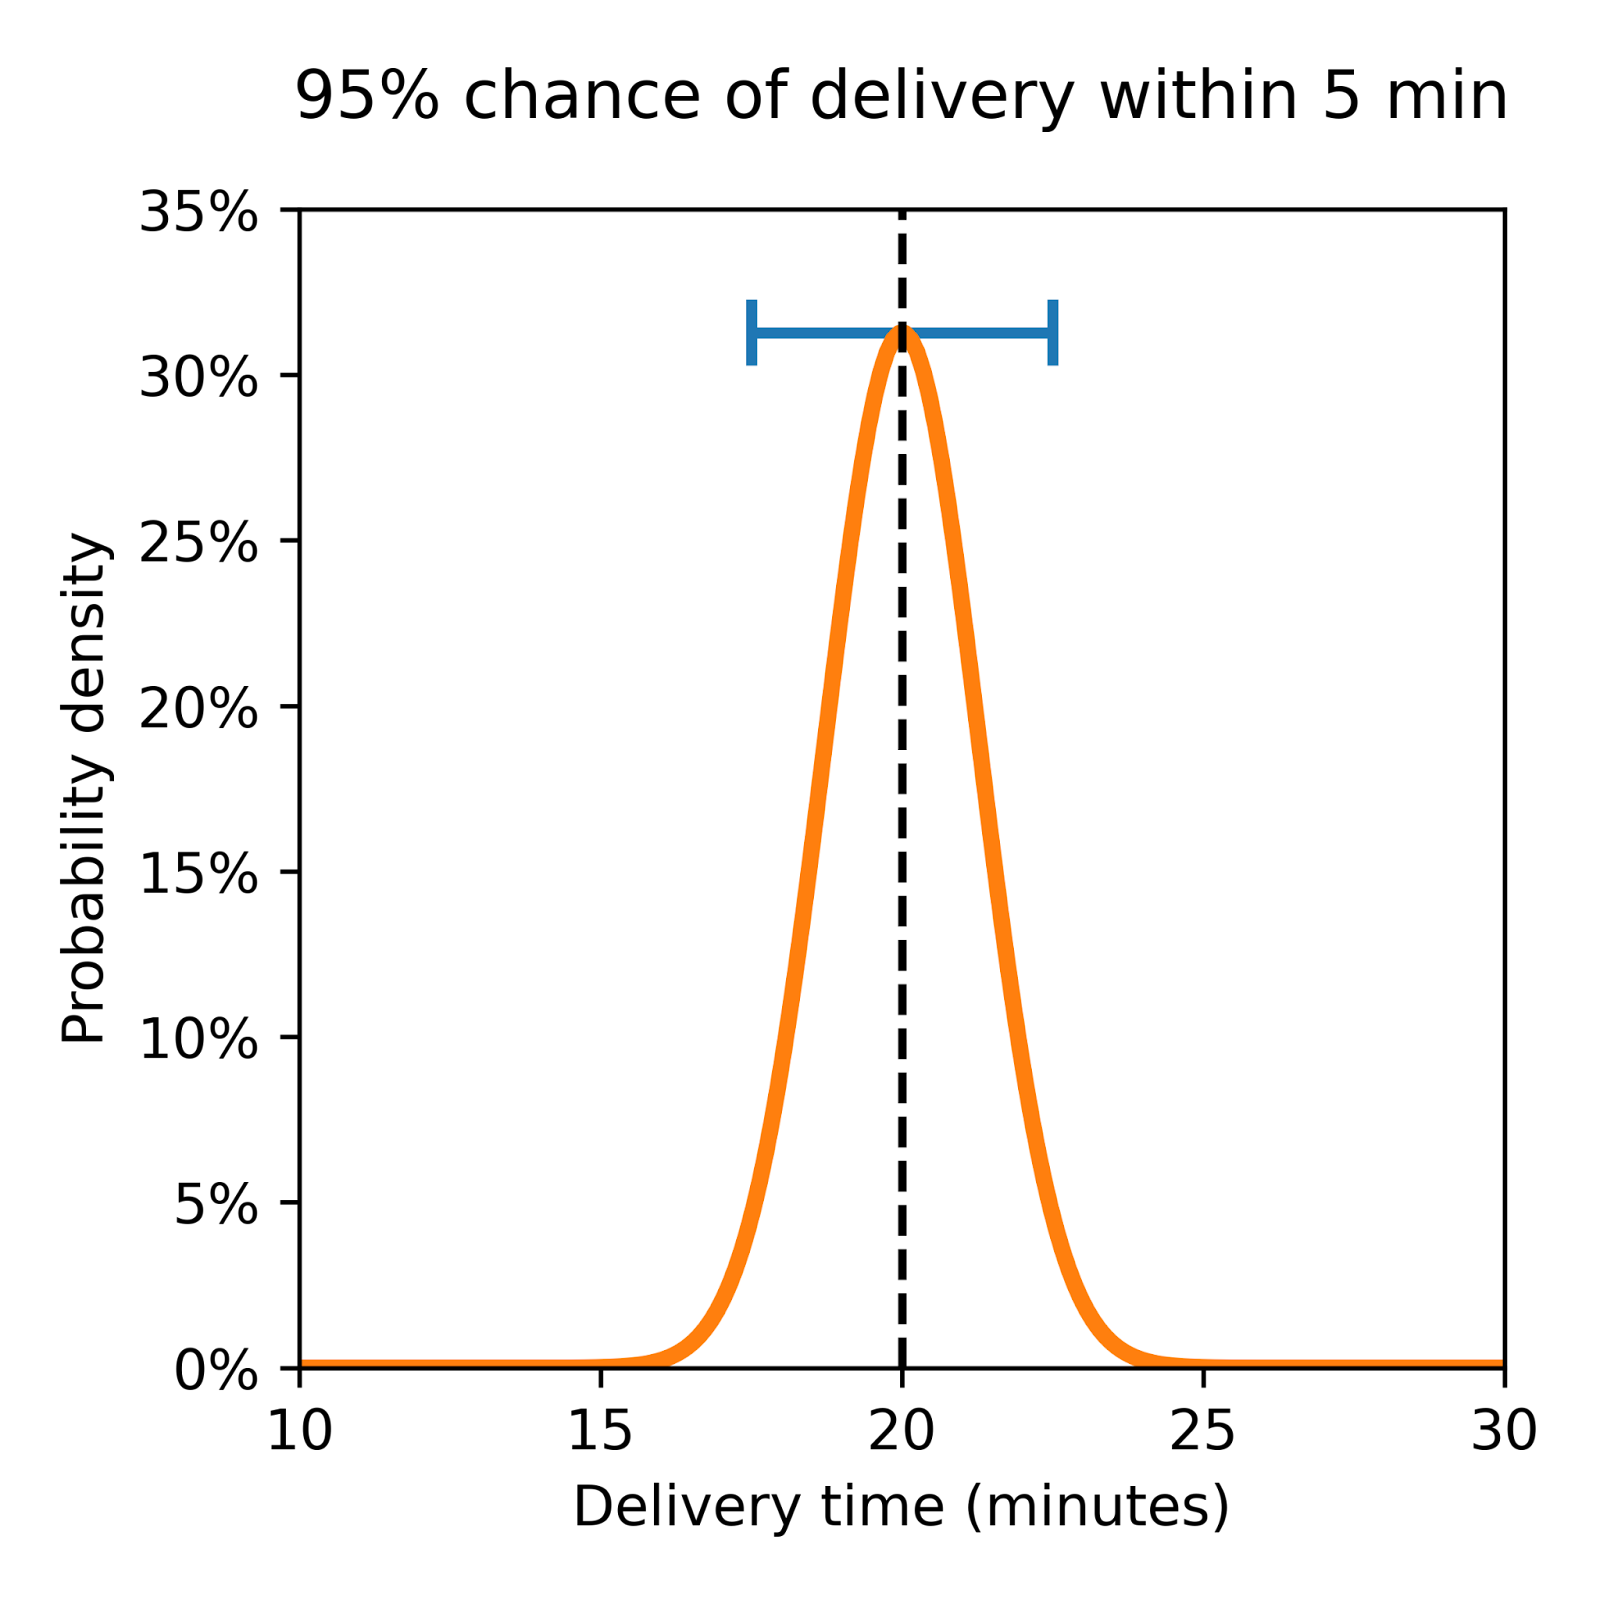 |
| This distribution shows a wide spread, indicating significant variability. Although the average ETA is 20 minutes, actual delivery times may vary widely, reflecting a high level of uncertainty. | Here the distribution is closely clustered around the 20-minute mark. This tight grouping suggests that deliveries will likely align closely with the estimated time, indicating lower uncertainty. |
These visuals underscore an important concept: It’s as crucial to understand the probability of all possible outcomes via a distribution's shape and spread as it is to know the mean ETA, or most likely arrival time. That’s why our new base layer was developed to produce a probabilistic forecast of delivery time, giving us a much more developed understanding of uncertainty.
Deep Dive — Evaluating the Accuracy of a Probabilistic Forecast
With our shift to probabilistic forecasts, we encounter a new challenge: Measuring the accuracy of our predictions. Unlike point estimates, where accuracy is assessed in a straightforward manner through metrics like mean absolute error (MAE) or root mean square error (RMSE), probabilistic predictions require a different approach.
Weather forecasting offers valuable insights into what is required to meet this challenge. Forecasters predict probabilities for weather events in a similar manner to our delivery time predictions. In both cases, there's a single actual outcome, whether it's a specific temperature or a delivery time, involving two primary metrics: Calibration and accuracy.
Calibration
Probabilistic calibration ensures a model's predicted distributions align closely with actual outcomes. In other words, realizations should be indistinguishable from random draws from predictive distributions. Consider a weather model that predicts temperature ranges with certain probabilities. A model that consistently underestimates high temperatures likely has a calibration issue.
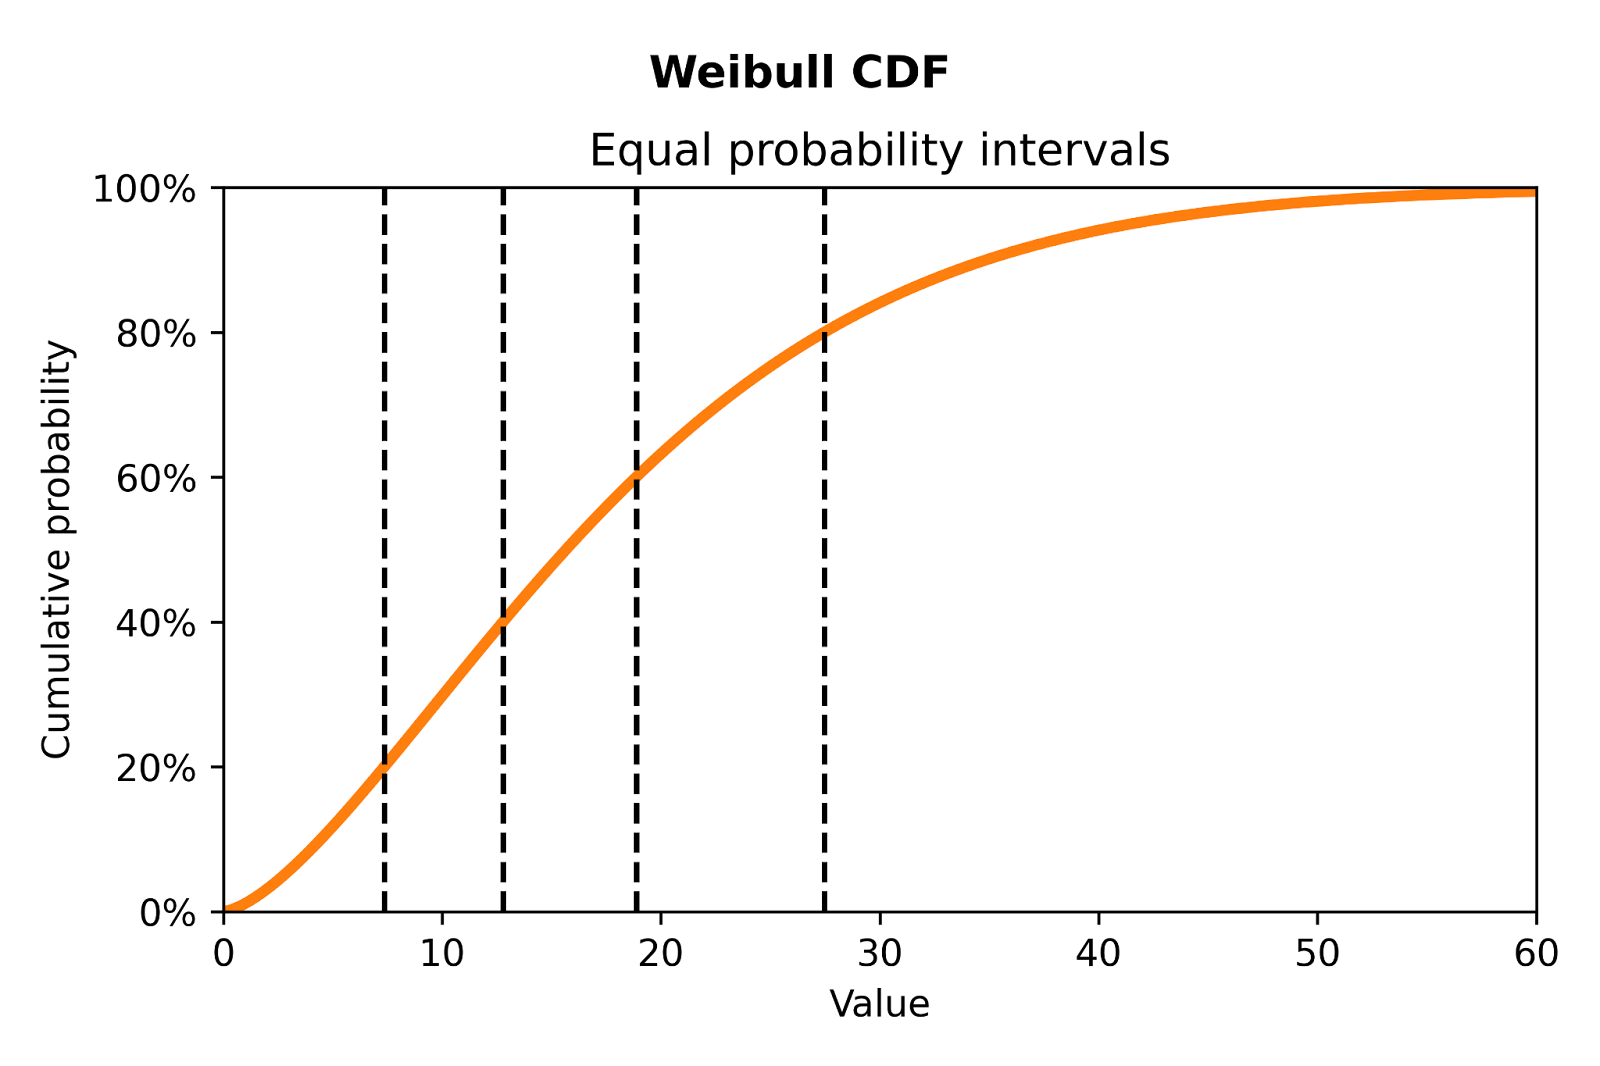
To apply this to DoorDash’s ETA model, imagine our deliveries all have the same underlying distribution. Figure 3 shows lines on a Weibull cumulative distribution function (CDF) that denote five equal probability buckets. If the predicted distribution is accurate, we can expect an equal number of deliveries to land in each bucket.
The following simulation illustrates the different types of calibration errors. In Figure 4 below, we show the results of simulating two underlying distributions versus a well-calibrated static predicted distribution. To create a probability integral transform (PIT) histogram visualization, we drew 500 deliveries and plotted the actual delivery times against our predicted quantiles to inspect probabilistic calibration.
| Well-Calibrated | Under-Dispersion | Over-Dispersion |
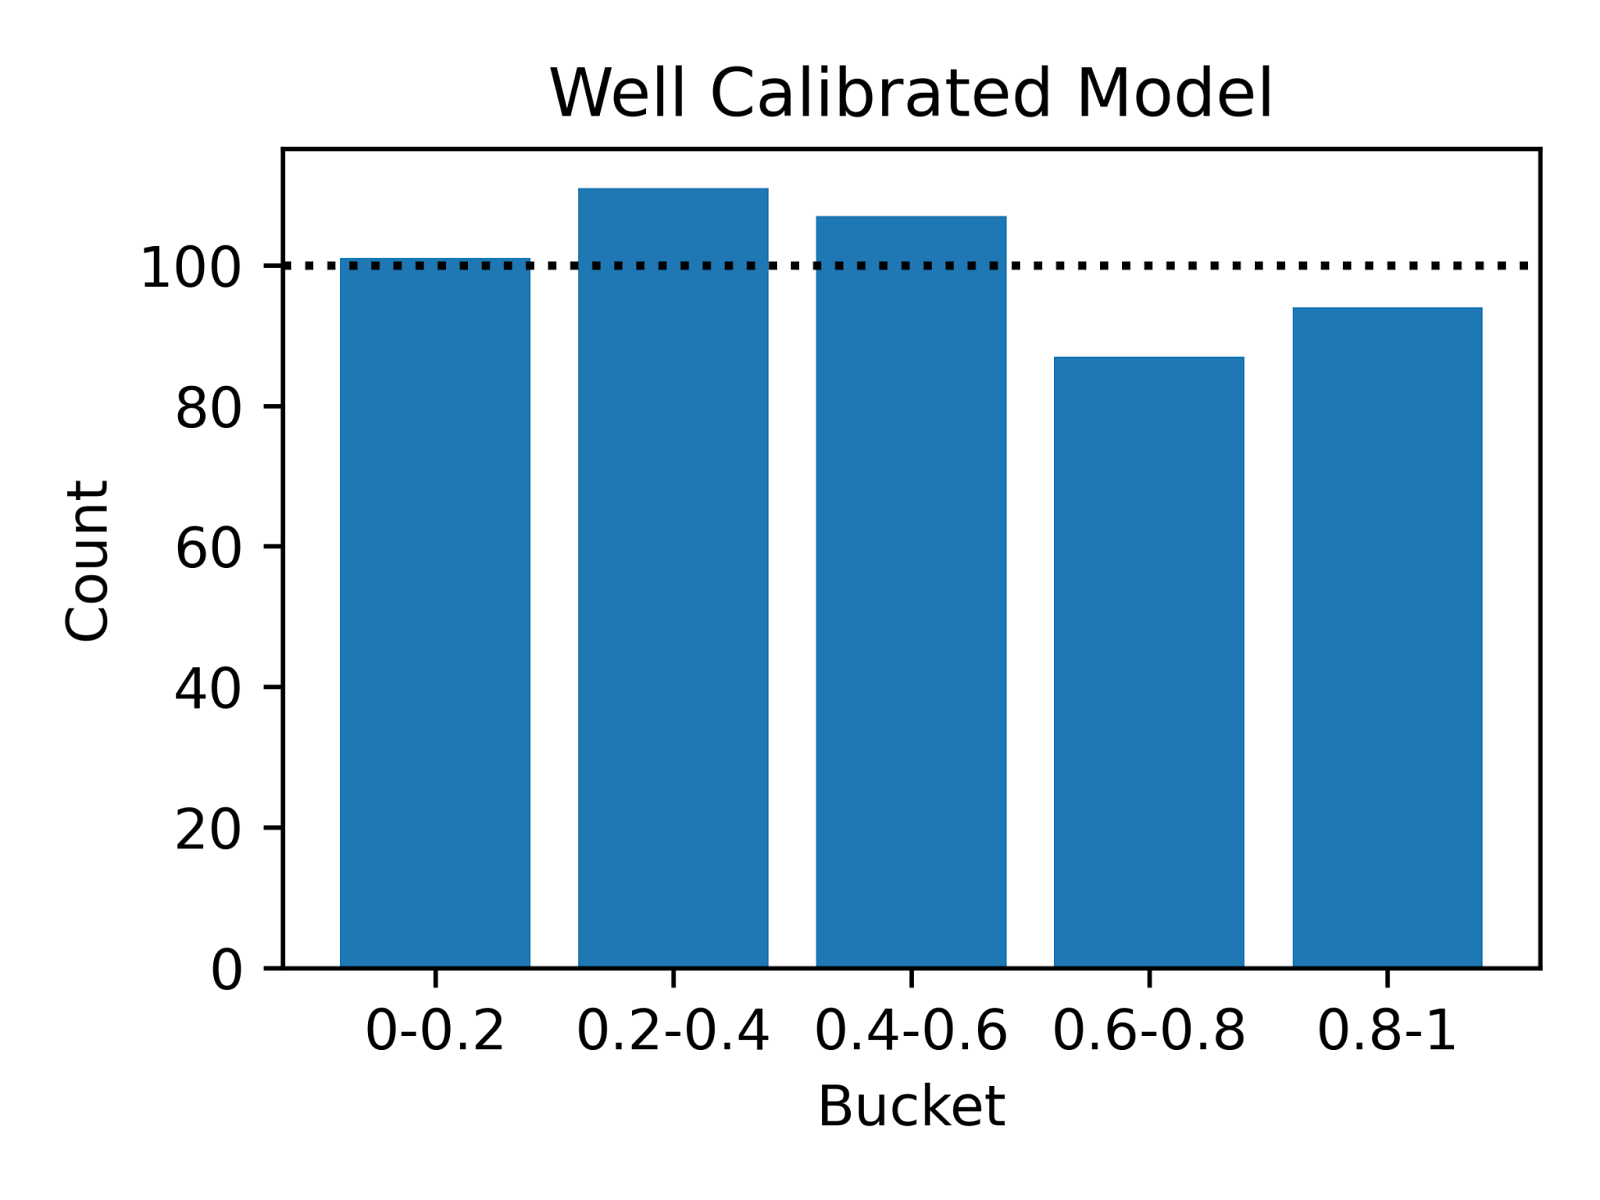 | 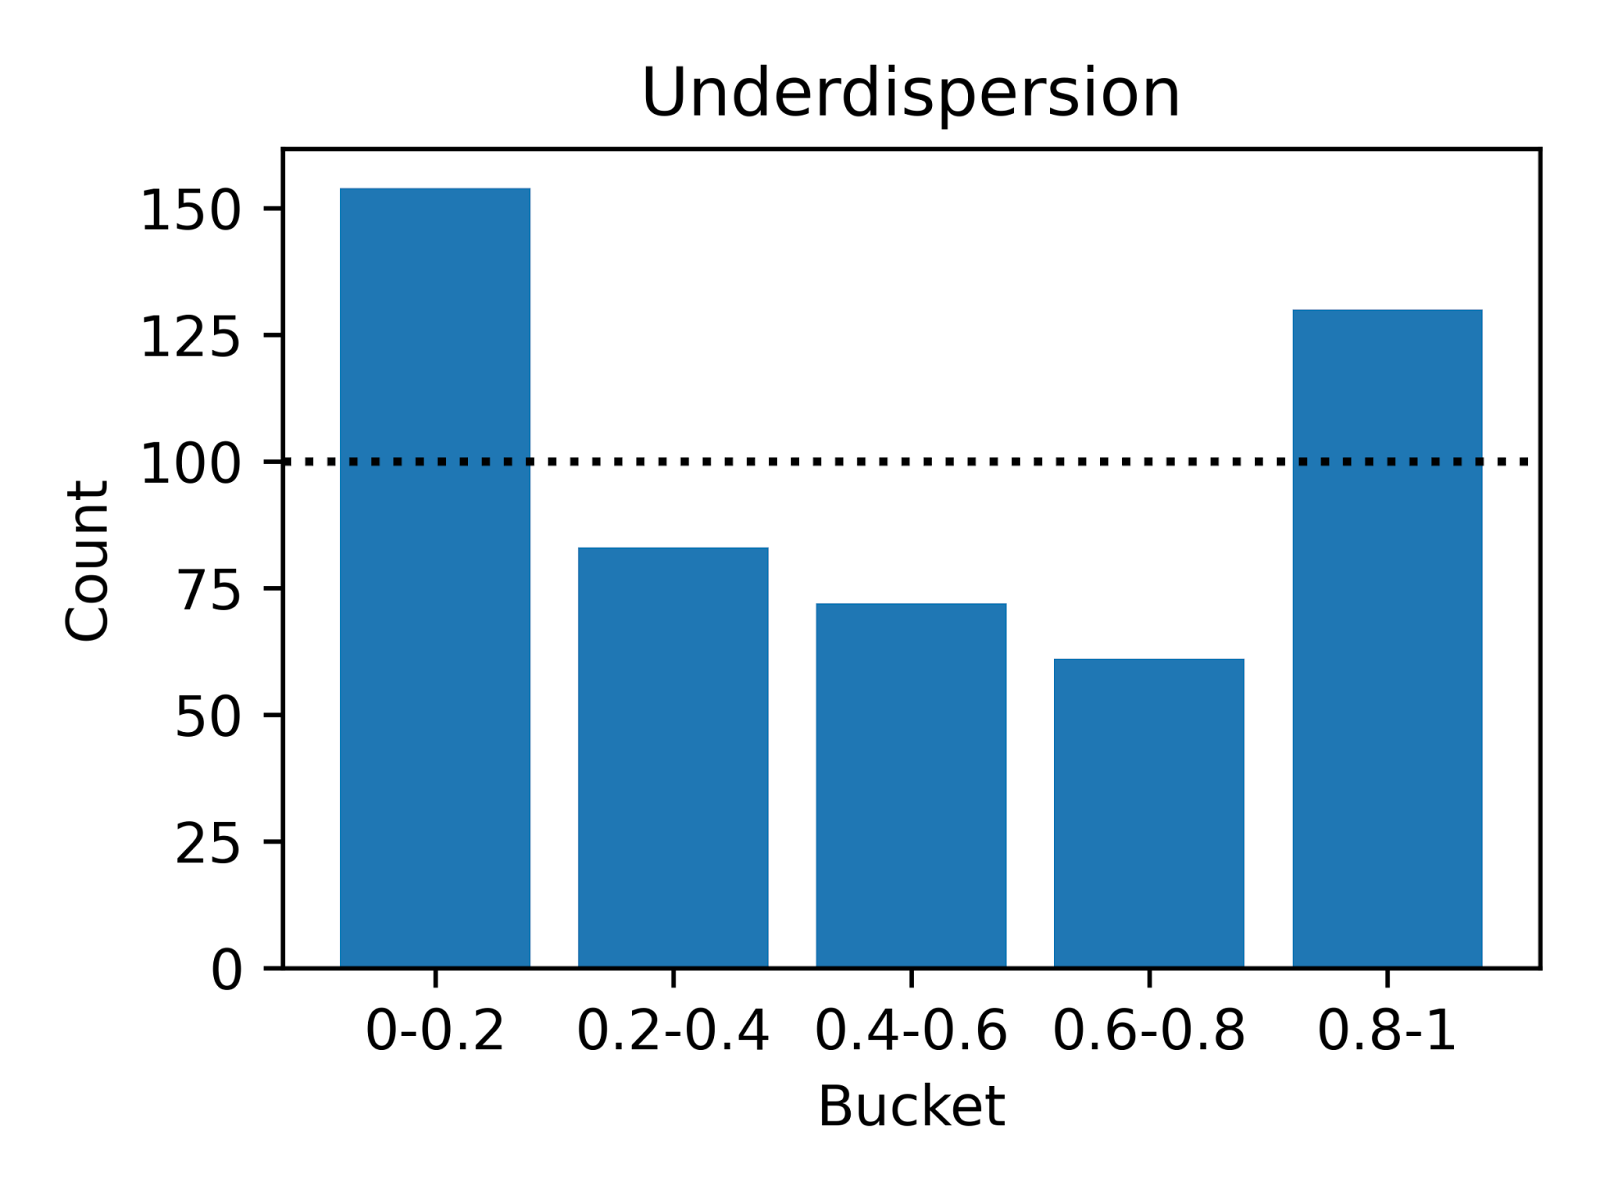 | 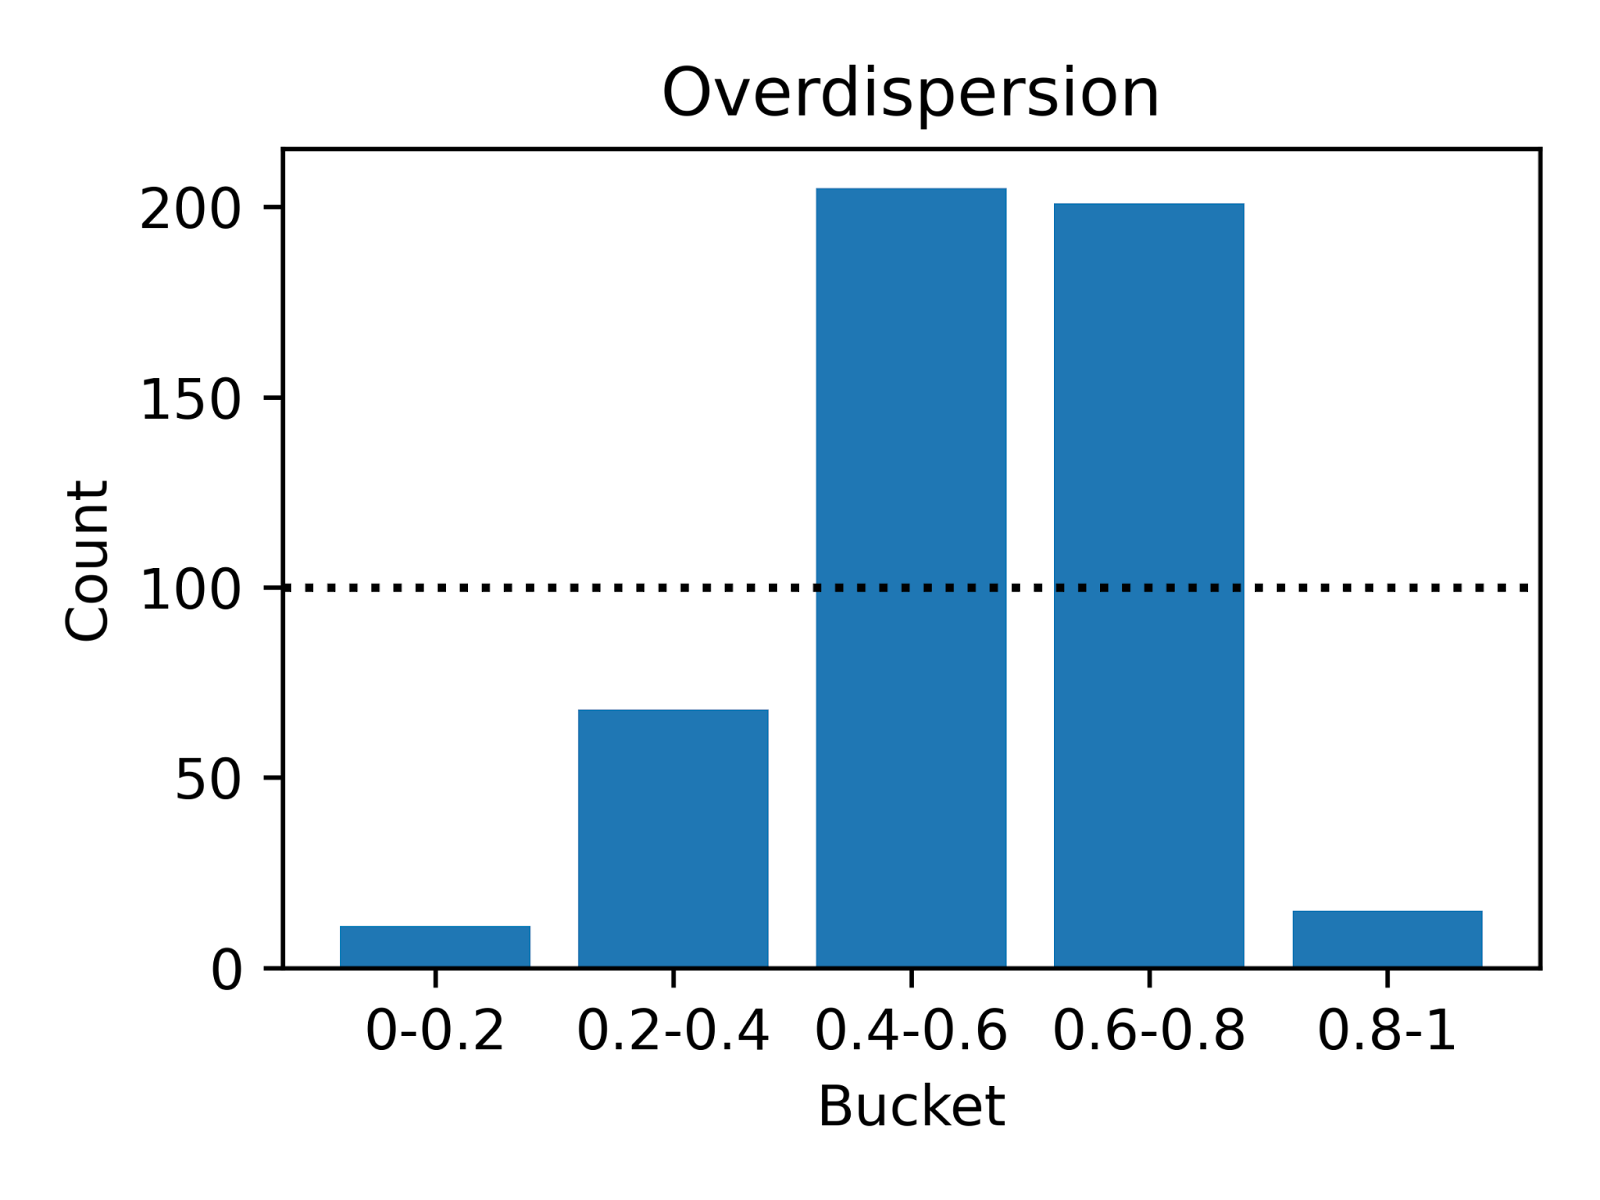 |
| Deliveries are evenly distributed across the quantiles, indicating accurate predictions. | A U-shaped pattern suggests the model predicts a wider range than observed, indicating over-caution. | An inverse-U shape reveals the model underestimates variability, missing the extreme cases. |
These visuals show how well our model captures the real-world variability in delivery times. Calibration is key to ensuring that our predictions are not just accurate for the most likely delivery time, but also reliable and reflective of actual delivery scenarios.
Accuracy
While calibration is essential, it cannot by itself encompass the complete picture of a model's accuracy. To holistically assess our model, we need a unified metric that can compare different models effectively. Here, we borrow from the weather forecasting field once again, employing a technique known as the continuous ranked probability score (CRPS).
CRPS extends the concept of MAE to probabilistic forecasts. The formula for CRPS is:
CPRS(F(· |X), x) ﹦∫ (F(y|X) - 1{y ≥ x} )2 dy
Where:
- F(y|X) represents the CDF of the forecast, conditioned on the covariates X
- x is the single observed delivery time for an order
- 1{y ≥ x} is the indicator function, equal to 1 if y ≥ x and 0 otherwise
In simpler terms, CRPS measures how well the predicted distribution (every point weighted by its probability) aligns with the actual observed delivery time. Visually, we want to minimize the area between the predicted CDF and a vertical line at the observed delivery time, with a higher CRPS penalty for the area further away from the observed delivery time due to the square. Figure 5 shows two examples of this:
| Less Accurate | More Accurate |
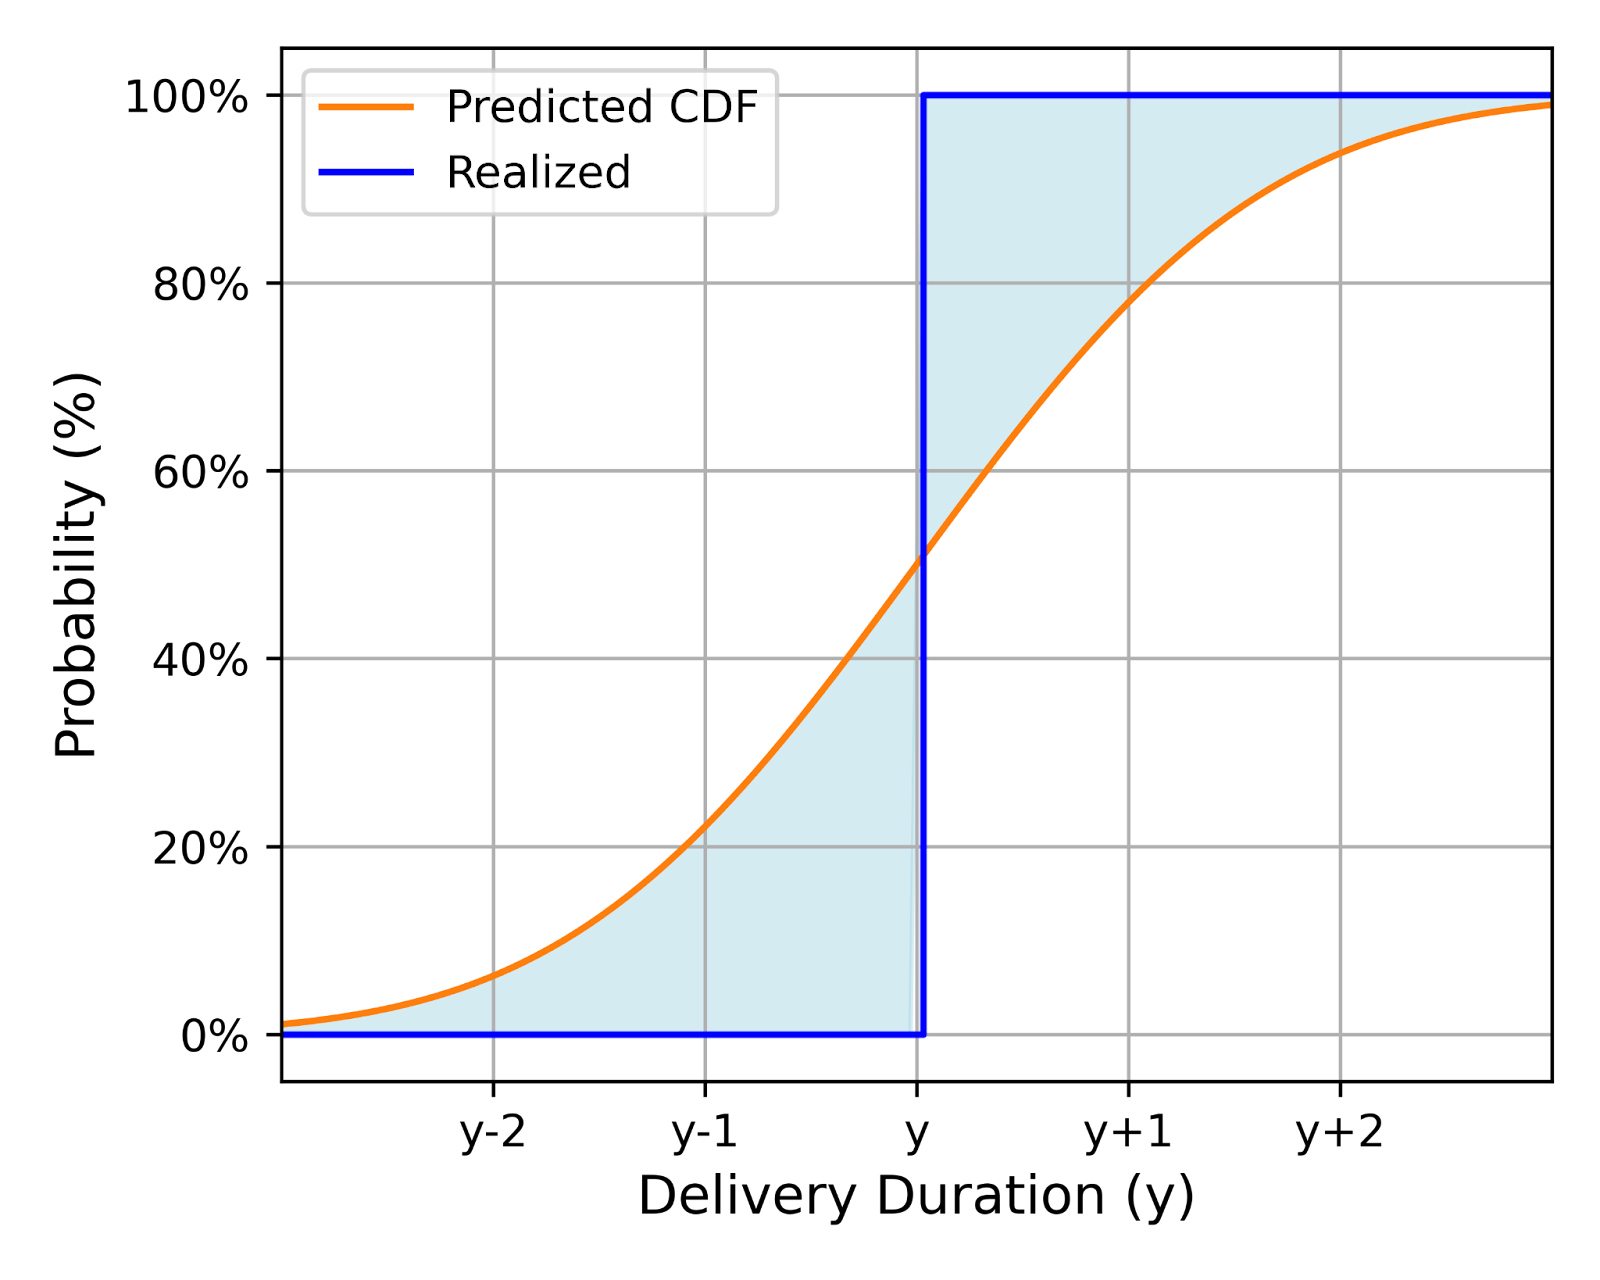 | 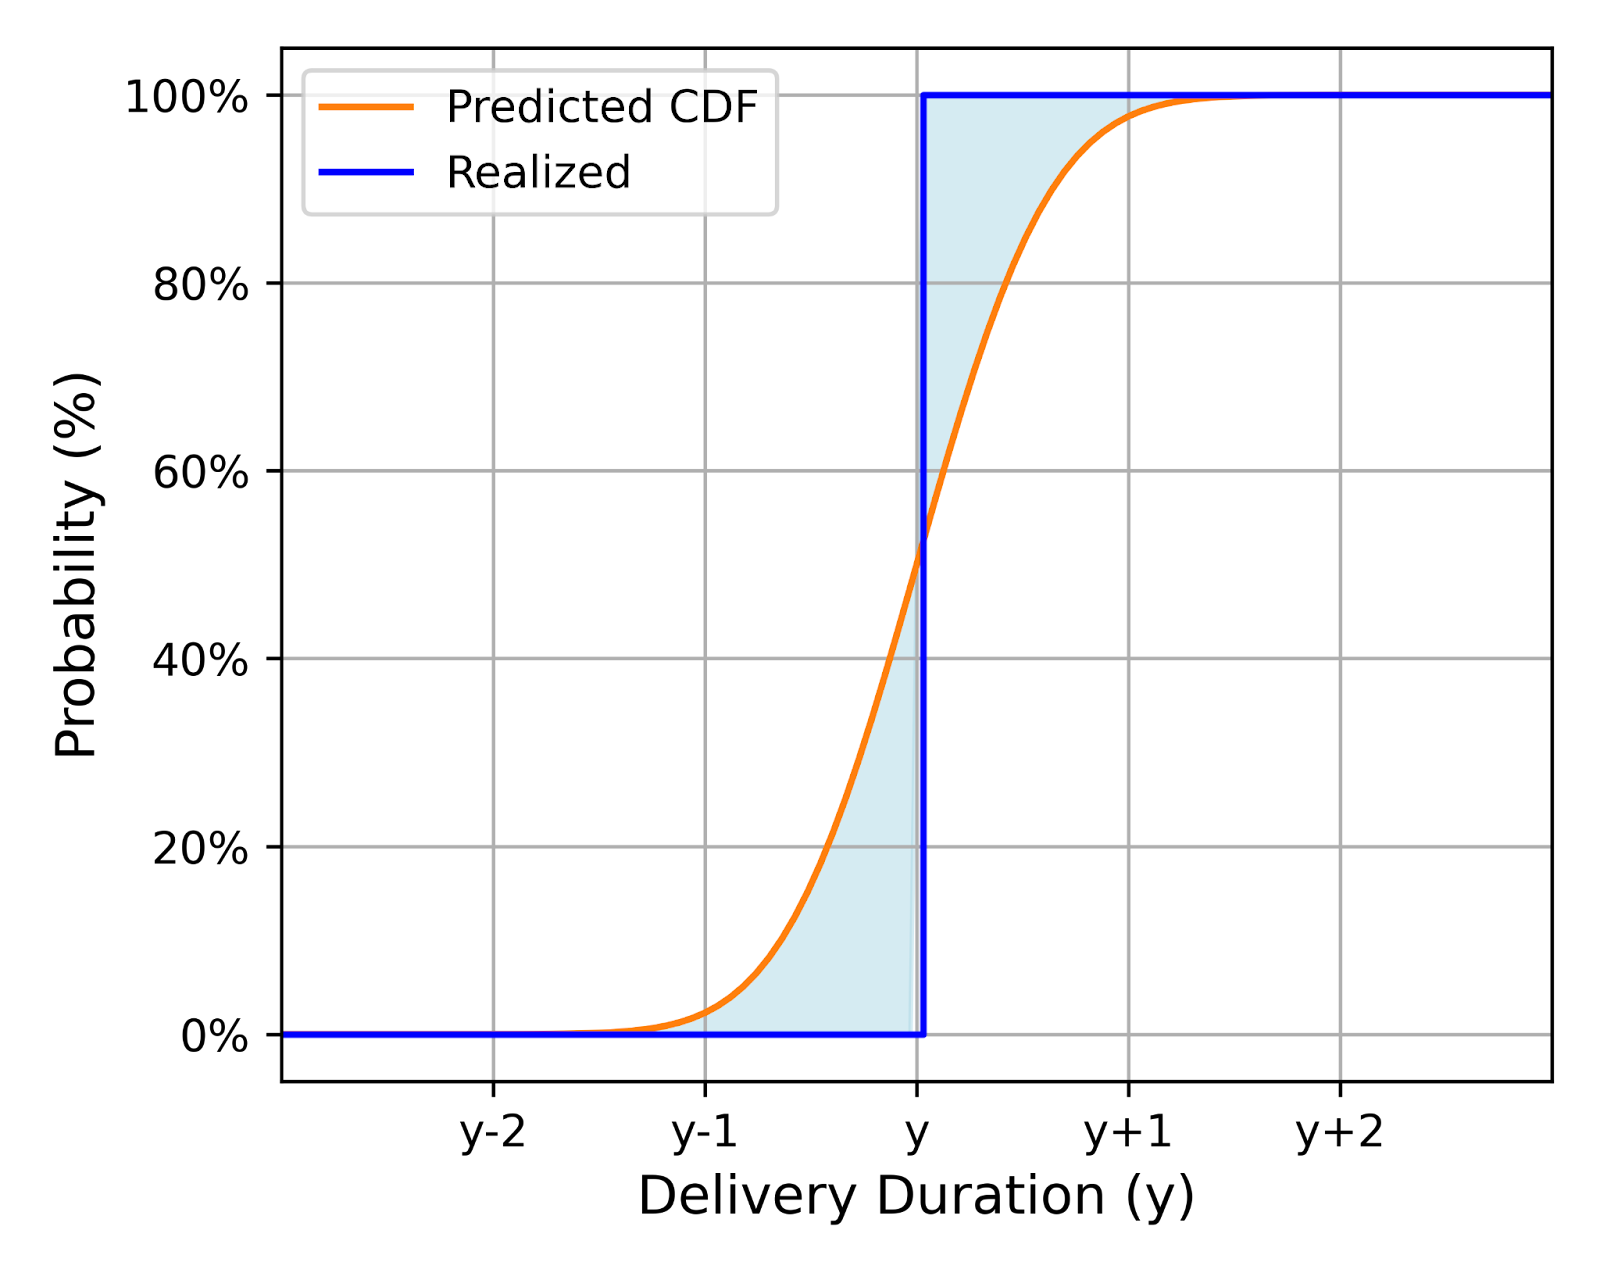 |
| Shows a larger area between the predicted CDF and the observed time, indicating lower accuracy. | Exhibits a smaller area, suggesting a closer alignment between prediction and reality. |
By averaging the CRPS across multiple predictions, we derive a single, comparable score for each model. This score is crucial to identify both those areas where our model excels and where it needs refinement, ensuring continuous improvement in ETA predictions. We have made significant strides in the probabilistic prediction and distribution evaluation, marking a milestone in our journey. But this journey is far from over; we anticipate further improvements and breakthroughs as we continue to refine and advance our efforts.
Experiment Results
Combining the above techniques, we developed three versions of NextGen ETA models which all improve consumer outcomes.
- Accuracy: Our north star metric for the NextGen ETA metric measures how often a delivery arrives on time according to our prediction and the overall quality of our model
- Consistency: Our guardrail metric ensures our ETAs are consistent and that customers don't see large changes in their ETAs

Conclusion
At DoorDash, our commitment to providing transparent and accurate information is a fundamental part of fostering trust with our consumers. Understanding that the ETA is crucial for our customers, we've dedicated ourselves to enhancing our estimates’ precision. Through embracing advanced predictive modeling with multi-task models, deep learning, and probabilistic forecasts, we're producing world-class predictions while accounting for real-world uncertainties. This approach doesn't only improve our service; it reinforces our reputation as a reliable and customer-centric platform, ensuring that every ETA we provide is as accurate and trustworthy as possible.


