 Qixuan Wang
Accurate and reliable observability is essential when supporting a large distributed service, but this is only possible if your tools are equally scalable. Unfortunately, this was a challenge at DoorDash because of peak traffic failures while using our legacy metrics infrastructure based on StatsD. Just when we most needed observability data, the system would leave us in the lurch.
That’s why we decided to migrate our observability technology stack to Prometheus-based monitoring. As we continue to scale DoorDash’s business, using Prometheus lets us eliminate metrics loss, scale up our metrics usage, standardize our metrics labels, and significantly lower overall costs. In this article, we explain how we accomplished the migration, first reviewing the challenges we faced with StatsD and then discussing how we selected and implemented Prometheus as our preferred solution.
Challenges Faced With StatsD
StatsD was a great asset for our early observability needs, but we began encountering constraints such as losing metrics during surge events, difficulties with naming/standardized tags, and a lack of reporting tools. We’ll briefly introduce StatD’s history before diving into those specific issues.
StatsD was originally developed and released by Etsy to aggregate and summarize application metrics. StatsD is a network daemon built in Node.js that listens for messages containing statistics, like counters and timers, so that it can send aggregates to configurable backends.
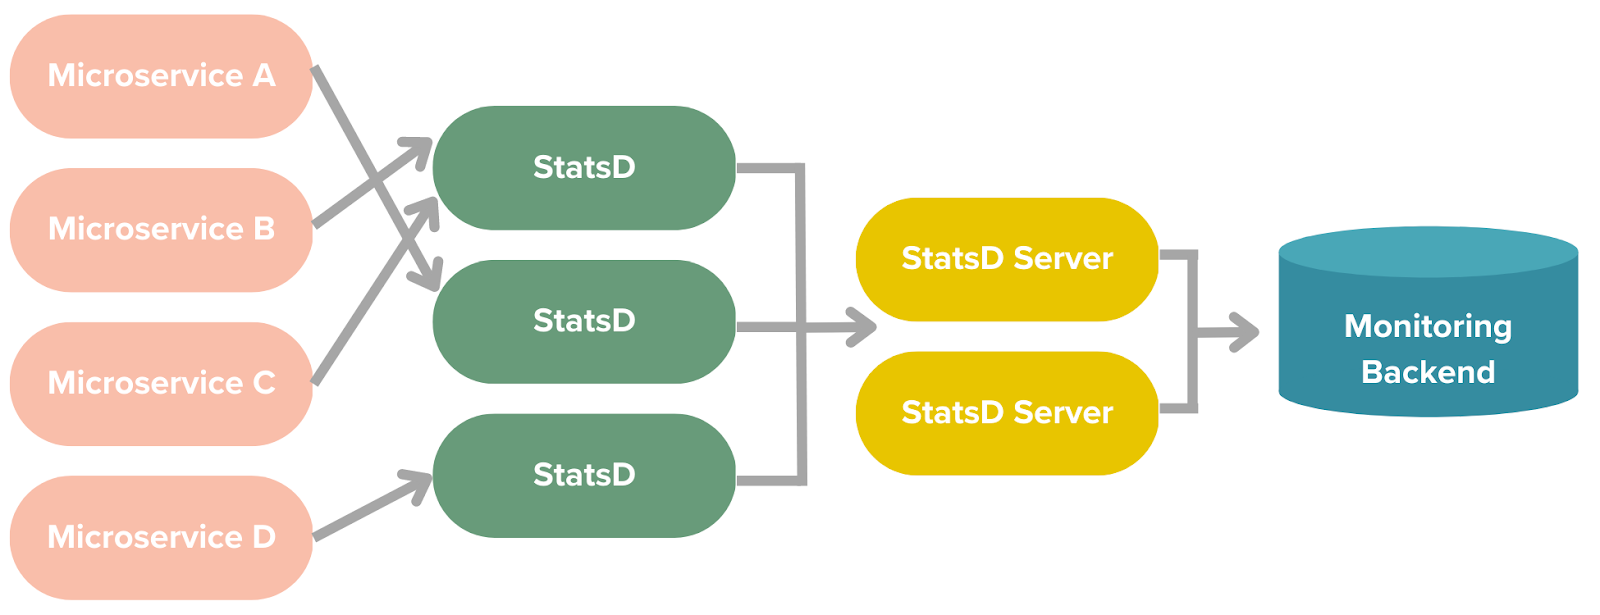
Figure 1: DoorDash previously used StatsD proxy and server pipelines for microservices’ metrics
The design shown in Figure 1 reflects our legacy architecture for observability. Unfortunately, there were numerous issues with this design which elaborate below, including:
- There was potential for User Datagram Protocol (UDP) packet loss, but there was no practical way to detect such a loss, which could result in a metrics information gap
- There was no naming standardization and insufficiently granular tags
- There was no histogram function and no way to aggregate percentiles
Packet loss
StatsD proxy reads messages from the OS recv buffer, which receives and holds them prior to processing. If messages arrive too quickly, this buffer fails to process all of them, overflows, and begins to drop packets. If a StatsD proxy or server instance is offline for any reason, metrics from that instance are lost. StatsD clients send data over UDP, which provides no guarantee of delivery at the transport layer making proxy outages transparent to downstream servers. Although the packet loss can be detected, more sophistication and complexity are required to identify them relative to any other simultaneous flows.
Lack of naming standardization and limited tags
The StatsD-based monitoring pipeline lacks naming standardization and has limited support for tags. The StatsD server sends metrics to a proxy, which interprets the telegraf format of StatsD to support point tags. For example, the original StatsD metrics are sent in the following format:
Generic:
<metricname>:<value>|<type>Example:
prod.k8s-instance1.podxk723.eta.dynamic-eta.predict:129|cHowever, this convention does not allow a simple way to standardize the metric names and embedded tags. To prevent exponential growth, an additional aggregation tier must be added to consolidate on critical values before the storage tier.
Lack of histogram function
Finally, the StatsD pipeline’s lack of full support for a histogram data type complicates analysis related to latency percentiles. This necessitates computation of required percentiles for latencies, for example what percent of metric values are below an arbitrary threshold. Pre-computation adds complexity to the pipeline and makes it impossible for users to explore the data using different thresholds or percentiles, ultimately diminishing the overall value of the metrics information.
Requirements for our upgraded observability tooling
1.) Based on these issues with StatsD, we set some principles and requirements for our next solution:A strong preference for use of open-source and emerging standards
An open-source monitoring system allows to take advantage of the following:
- Cost efficiency: The cost advantages of using open-source software typically are greater than the investment to build and maintain these systems.
- Integration: We use open-source systems to make our metrics, dashboards, and alerts portable. We can take advantage of the open-source data formats and query languages. And many current and future vendors support these standards, which provides evolutionary flexibility.
- Self hosting: Partnering with a vendor speeds deployment while aligning on open-source standards ensures the pipeline remains vendor agnostic until the final step, maintaining future flexibility.
2.) Better governance and control
Aligning all services on standard naming/tagging metrics conventions achieves consistency within the broader observability ecosystem.
- Standard conventions: While we prioritized providing stable and reliable monitoring, we also wanted to better control the conventions we used and ensure similarity across our other observability systems. Setting naming conventions and common tags optimizes for any future reset of dashboards and alerts.
- Rate controls: From the start, we wanted to build the capability to report usage aggregation in line with our labeling standards — for example, per namespace — and to apply selective controls to source services that violated our agreed-upon envelopes such as rate and cardinality.
- Integration enablement: We sought to enable correlation of metrics data with events across other domains. This allows deeper integration between systems, including logs and traces, and allows metrics data to be used for adjacent requirements such as cost attribution.
3.) Self-service capabilities
To speed up the migration, we needed to empower productivity and automate the general onboarding process.
- Productivity empowerment: This process means that every parameter is discovered based on existing deployment methodology.
- Onboarding automation: After the developer’s service is registered, these same configurations are used to discover the service and start collecting related metrics. No additional steps are required to build dashboards or create service alerts.
Migrating to Prometheus-based monitoring
With these new observability principles and guidelines, we made the choice to migrate to open-source Prometheus-based monitoring.
Why Prometheus?
Prometheus has emerged as the dominant standard for open-source metrics and is aligned well with our strategy and requirements. It has achieved broad support for both the client-side production of metrics data and the server-side consumption and presentation of that information. The strong community support among many vendors has created a large ecosystem of exporters and shared knowledge that jump-starts integration with almost any source system.
The adoption of Prometheus into the Cloud Native Computing Foundation has ensured strong support for the more fundamental tools used at DoorDash, including Kubernetes and Envoy. Prometheus includes a replaceable time-series database coupled with a service to manage collection and retrieval of the data using a powerful PromQL syntax. A closely coupled peer project delivers an integrated alert manager that extracts critical real-time insights from the data stream.
Our Prometheus migration process
The migration was handled in two phases. First, the observability team migrated the infrastructure components and set up the new metrics collection pipeline with auto-service discovery in parallel to existing pipelines; service owners simultaneously enabled the new endpoints on their owned components. Next, we partnered as consultants with the service owners to migrate related dashboards, alerts, SLOs, and similar tools as explained below.
Service instrumentation with Prometheus clients and libraries
Metrics clients and libraries generate and expose metrics via an HTTP endpoint. Prometheus supports most programming languages and popular frameworks, so instead of using a facade like a micrometer, service owners are encouraged to use Prometheus libraries natively. We deliver this native support through a common platform library by default, but service owners can use custom libraries/clients if they have bespoke requirements. Where there are challenges with native client support, such as third-party components, service owners may also deploy an exporter as a sidecar to satisfy their metrics requirements.
Internal libraries
We provide common internal libraries based on open source standards to ease adoption by most service owners. These libraries include support for metrics generated by all other platform functions, such as DB or MQ interactions, so developers don’t have to consider the instrumentation of these interactions and can instead focus on metrics related to their business logic.
Community libraries
We encouraged service owners and teams to use Prometheus native libraries to generate application metrics rather than using other metric facades. This avoids potentially inconsistent behavior stemming from how facade systems implement Prometheus paradigms such as histograms or summaries.
Exporters
Where the service or component is not fully controlled by the owner, it may be necessary to export Prometheus metrics via a function-specific exporter. The community offers many exporters that can be leveraged to provide high-quality metrics from non-native sources. As one of many examples, we include the JVM Prometheus exporter in our base images; service owners can enable the JVM metrics using the exporter. Similar exports are deployed for many databases and infrastructure components throughout DoorDash.
Metrics Collection
There are a number of distinct use cases for metrics collection:
- Kubernetes collection: The metrics collector is deployed as a DaemonSet on each Kubernetes node to scrape targets that are determined to be local based on annotations maintained in the Kubernetes configuration for service discovery. Because most microservices in DoorDash are deployed in Kubernetes clusters, this represents the vast majority of metrics collection by volume.
- Exporter collection: As an example, consider metrics extraction from an underlying AWS infrastructure. The AWS CloudWatch service exposes the data allowing us to deploy the open-source CloudWatch metrics exporter to copy relevant data into our common Prometheus environment. There are two popular CloudWatch exporters: the official Prometheus CloudWatch exporter and the open-source alternative YACE exporter, which is short for Yet Another CloudWatch Exporter. We selected YACE because it provides optimizations that result in less load on the CloudWatch API and it boasts an easy discovery mechanism. The key difference between the two is that YACE’s core functions use the GetMetricData API call to get metrics, while the official exporter uses the GetMetricStatistics API. Similar methodology is used to export metrics from various other third-party components used within our infrastructure.
- Collection for short-lived jobs: In some cases, short-lived jobs are not available for scrape via this mechanism. For these cases, we deploy the Prometheus Aggregation Gateway to provide the push-based metrics target necessary for custom workloads. This is not a preferred collection pattern, but enables full use case coverage for metrics collection.
Standard tags for all metrics
To improve metrics consistency and maximize reusability of related dashboards and alerts, we have defined common tags which are added to all Prometheus metrics. These common tags are useful to create common dashboards and alerts to monitor service health.
Some of the common tags for all metrics include:
- service: The service name registered in our internal service registry
- app: The application within a service (for example, web vs. mobile)
- environment: to indicate the service is in production vs. staging environment
- region: The cloud region where this workload is running
- zone: The cloud availability zone where this workload is running
Figure 2 below shows an example of how these common tags are used as filters in most dashboards.
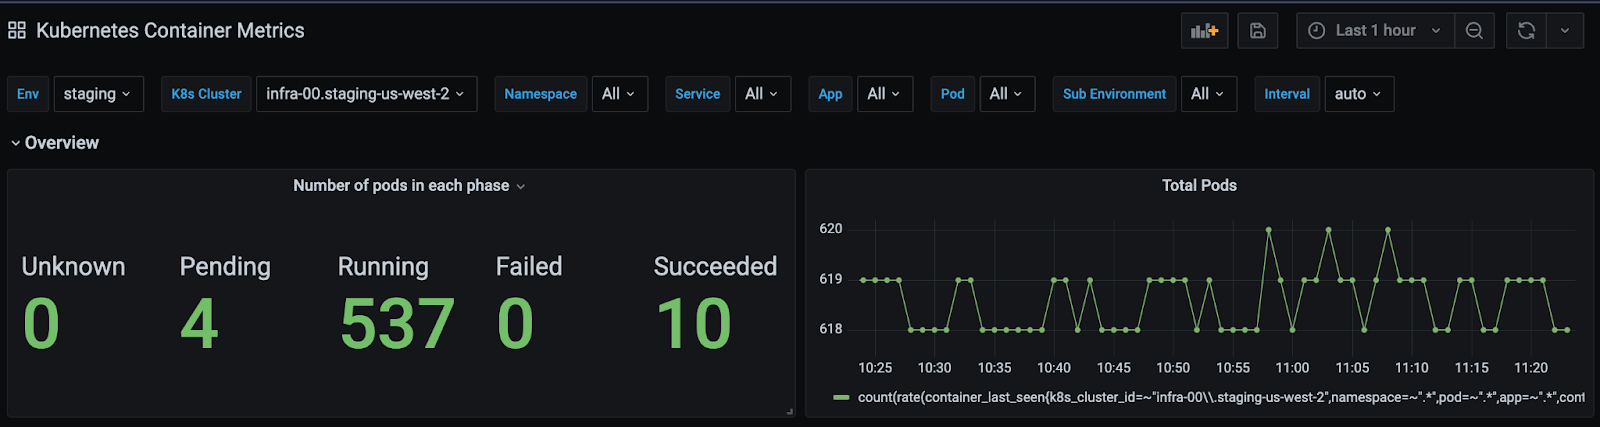
Figure 2: One of the dashboards that use common tags for filter and query
Ingestion Optimization
The collection process enables an efficient rules-based aggregation before the data is committed to the storage tier. This is used to optimize high-label cardinality metrics and improve performance by reducing or eliminating unwanted label dimensions, producing a representative metric based only on remaining labels. The process also drops metrics completely if no dashboards or alerts currently reference them. Finally, metrics resolution is reduced after ten days to maintain trending data for historical look-back comparisons while sharply reducing storage needs.
Relabel rules
Relabel rules are used to rewrite a target’s label set dynamically during the scrape event in order to optimize the intake process at its genesis. Within the metrics collector, we configured the relabel rules to consolidate values and drop low-value labels or metrics.
Using codification for alerts
A robust metrics-based alerting system notifies engineers of critical events when specific threshold criteria are matched. At DoorDash, we have codified our alerts to obtain key benefits:
- Source control: All monitoring alerts must be source-controlled and configured/versioned via code rather than being modified directly in a UI. This ensures safe rollback capability and builds a history of changes.
- Alert templating: We wrapped the alert definitions in common templates with some logical default values for engineers to quickly define their alerts.
- Common labeling: By standardizing our label values as described above, we are able to map an alert to the team that owns this service and automate the routing of the related notification directly to the on-call direct rendering infrastructure for it. This largely eliminates any triage step and reduces mean time to repair.
Results and achievements
With all the strategies described above, we successfully completed the migration of all metrics, dashboards, and alerts. We no longer experience the periodic loss of metrics and our improved governance allows for greater consistency, predictability, and transparency in the metrics ecosystem. The Prometheus-based monitoring system is stable, scalable, and flexible, providing a greatly improved view of DoorDash service health.


 JoshZhu


