The Spatial Statistics team at Esri hosted a Webinar all about Calculating Composite Indices on Tuesday, Dec. 5th.
If you attended, thank you! We hope you enjoyed it! If you did not have a chance to attend the webinar, we hope you have the opportunity to watch the recording (linked below), and see some of the great questions we received in this FAQ!
Find a recording of the Esri Webinar here.
Frequently Asked Questions:
(1) In which version of ArcGIS Pro is the Calculate Composite Index tool available?
ArcGIS Pro 3.1 and later
(2) Are there any step-by-step learning workflows to follow?
There is a simple index example blog that walks through the steps and using the tool, as well as a recently published LearnGIS Lesson that walks through a more complex composite index example.
(3) What is the difference between simple min-max and custom min-max scaling for pre-processing input variables?
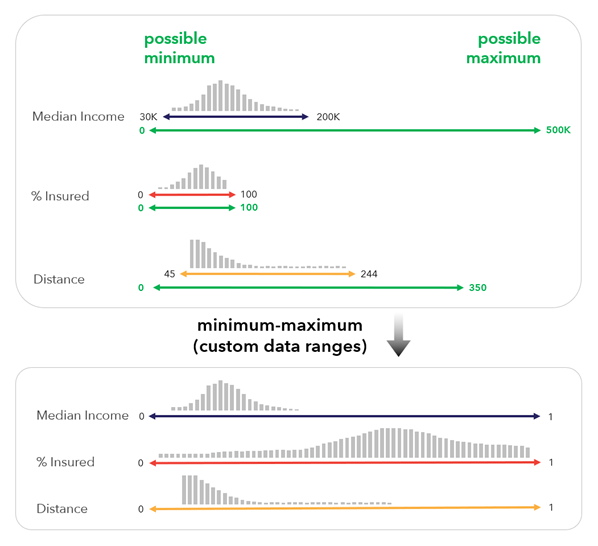
A simple min-max scaling takes the minimum value in the variable’s range and assigns it to 0, and the maximum value in the variable’s range and assigns it to 1, and scales every value in the middle between 0 and 1. This can be a great way to get all of your variables on the same range while retaining data distributions. For min-max with custom data ranges, the values assigned to 0 and 1 are specified by you, the user. This could allow you to use a standard scale over time (not changed by each year’s respective min and max), or to set up the scale with a theoretical minimum and benchmark maximum
(4) Can input variables be pre-processed using different methods?
In the Calculate Composite Index tool, each variable is pre-processed using the same method. For custom data ranges, those ranges are specified differently for each variable.
However, if you are creating sub-indices by running the tool multiple times, you are able to use different methods to pre-process each sub-index. However, it’s important to make sure each sub-index remains on a similar scale (i.e., both min-max and percentile range from 0 to 1 – that’s the same scale).
(5) How do you make correlation- and scatter-plots?
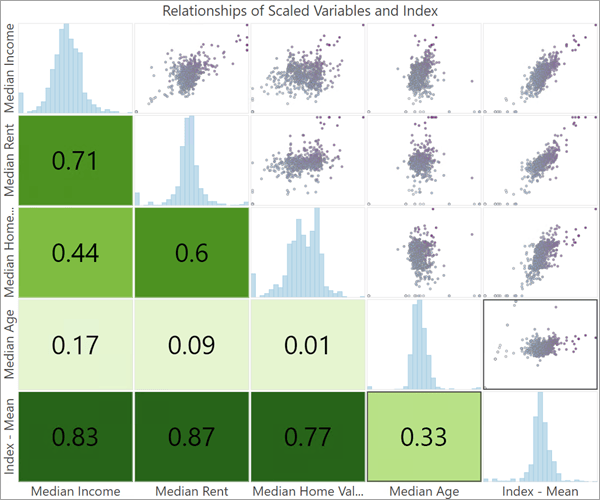
The correlation plots and scatterplot matrices we share in demos are automatically created as output with each run of the Calculate Composite Index tool.
You can also create these plot matrices yourself outside of the tool as a pre-analysis step using the built-in charting in ArcGIS Pro.
(6) What considerations are recommended for categorical or binary variables?
Binary variables (variables where the values are 0 or 1) are commonly used in composite indices. One of the defaults in the tool allows you to turn your inputs into binary variables (Create flag by threshold). This changes the interpretation from “how much larger is this value”, to, “is this value above a cut-off, yes or no”.
For categorical variables with more than two categories it’s a bit more tricky, since the tool does not take non-numeric values as an input. It may be a good idea to turn your categories into a binary variable or multiple binary variables (is the value of this variable equal to “A”, yes or no). You could also see if there is a numeric assignment that makes sense (can you reasonably assign the values 1-5 to each of your 5 categories, for example).
(7) Do we need to check the distributions of data before adding them into an index?
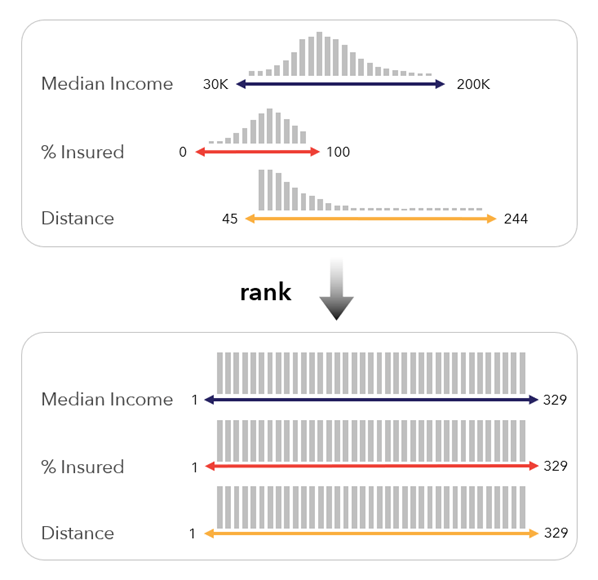
There are no distributional assumptions when calculating a composite index, but it can be useful to know if your pre-processing methods will be affected by things like skew or outliers. Methods like min-max scaling are very susceptible to what we call “data compression” when there are extreme outliers or extreme skew, so something like a percentile or rank scaling could be more appropriate.
(8) What should I do when I have a high number of variables and high multicollinearity in my variables? Can I use a dimension reduction technique like Principal Component Analysis?
Dimension reduction techniques can be useful in reducing multicollinearity (correlation and relatedness between variables) in your data, especially when the number of variables is large. The downside of doing this specifically for creating a composite index, is that you lose the direct transparency and interpretability of your index. What specific variables are influencing the result in a given location? That’s a hard question to answer with something like a principal component analysis. There do exist some dimension reduction techniques that allow for factor interpretability, however, using sub-indices, or manually reducing the number of variables is best practice for transparency of an index.
Further Resources
Creating Indices Webinar Recording
Composite Index Best Practices Technical Paper
Calculate Composite Index Documentation
How Calculate Composite Index Works
Environmental Justice Index LearnGIS Tutorial
Calculate Composite Index Simple Workflow Blog
esriurl.com/indexresources (continuously updated resource page)
check out esriurl.com/spatialstats to find other resources about Spatial Statistics tools in ArcGIS Pro.




Article Discussion: