Data Quality Dimensions: Assuring Your Data Quality with Great Expectations
This article highlights the significance of ensuring high-quality data and presents six key dimensions for measuring it. These dimensions include Completeness, Consistency, Integrity, Timelessness, Uniqueness, and Validity.

Photo by Mikael Blomkvist
Data quality plays a crucial role in any data management process. Organizations rely on data to inform their decision-making and drive various business efficiencies. However, if data is riddled with inaccuracies, errors, or inconsistencies, it can do more harm than good.
According to a 2020 Gartner survey, the average cost of poor data quality is $12.8 million per year. As indicated in the latest State of Data Quality report, production delay (product launch delay) is a telling symptom of poor data quality. High-quality, error-free data increases the reliability and trustworthiness of the insights derived from it.
To improve the quality of your data, you need a framework for measuring it. Data quality dimensions can help you achieve this goal. Dimensions enable you to measure coverage and identify any components that need data quality testing.
This article presents six dimensions of data quality: Completeness, Consistency, Integrity, Timelessness, Uniqueness, and Validity. By addressing them, you can gain a comprehensive understanding of the quality of your data and identify areas for improvement. Here is where Great Expectation (GX) comes into play.
Great Expectations
Great Expectations (GX) is a Python-based open-source tool for managing data quality. It provides data teams with the ability to profile, test, and create reports on data. The tool features a user-friendly command-line interface (CLI), making it easy to set up new tests and customize existing reports.
Great Expectations can be integrated with a variety of extract, transform, and load (ETL) tools such as Airflow and databases. A comprehensive list of integrations and official documentation can be found on the Great Expectations website.
GX features many expectations in its repository. This article demonstrates how to use a single expectation to implement data quality dimensions with GX.
Data
Before starting with implementation, we need to know more about the data we will use to demonstrate how dimensions work.
Let's say that I need to create a Data Mart analysis to find out how many orders the sales department took per region over the past three years.
We have some raw data for orders:
| Order ID | Order Date | Sales | Customer Name | |
| 5955 | 2021-05-27 | 314.6217 | Ann Chong | |
| 21870 | 2022-08-28 | 996.9088 | Doug Bickford | |
| 3 | 2019-03-04 | 6025.7924 | Beth Paige | |
| 19162 | 2021-04-11 | 403.5025 | Carlos Soltero | |
| 12008 | 2022-11-29 | 4863.0199 | Fred Wasserman | |
| 18630 | 201-09-16 | 4.9900 | Neola Schneider | |
| 18378 | 2022-01-03 | 1566.3223 | Doug Bickford | |
| 15149 | 2020-03-12 | 1212.7117 | Michelle Lonsdale | |
| 9829 | 2022-06-27 | 695.7497 | Eugene Barchas | |
| 5188 | 2020-08-15 | 16426.6293 | Doug Bickford |
And some raw data for customers:
| Customer Name | Province | Region | Customer Segment |
| Andrew Allen | Saskatchewan | Nunavut | Consumer |
| Trudy Brown | Nova Scotia | Nunavut | Corporate |
| Dionis Lloyd | Nunavut | West | Corporate |
| Cynthia Arntzen | Northwest Territories | Atlantic | Corporate |
| Brooke Gillingham | Ontario | Ontario | Small Business |
| Alejandro Savely | Nova Scotia | Nunavut | Consumer |
| Harold Pawlan | Newfoundland | Prairie | Corporate |
| Peter Fuller | Manitoba | Quebec | Consumer |
| Ionia McGrath | Quebec | Quebec | Home Office |
| Fred Wasserman | Ontario | Atlantic | Consumer |
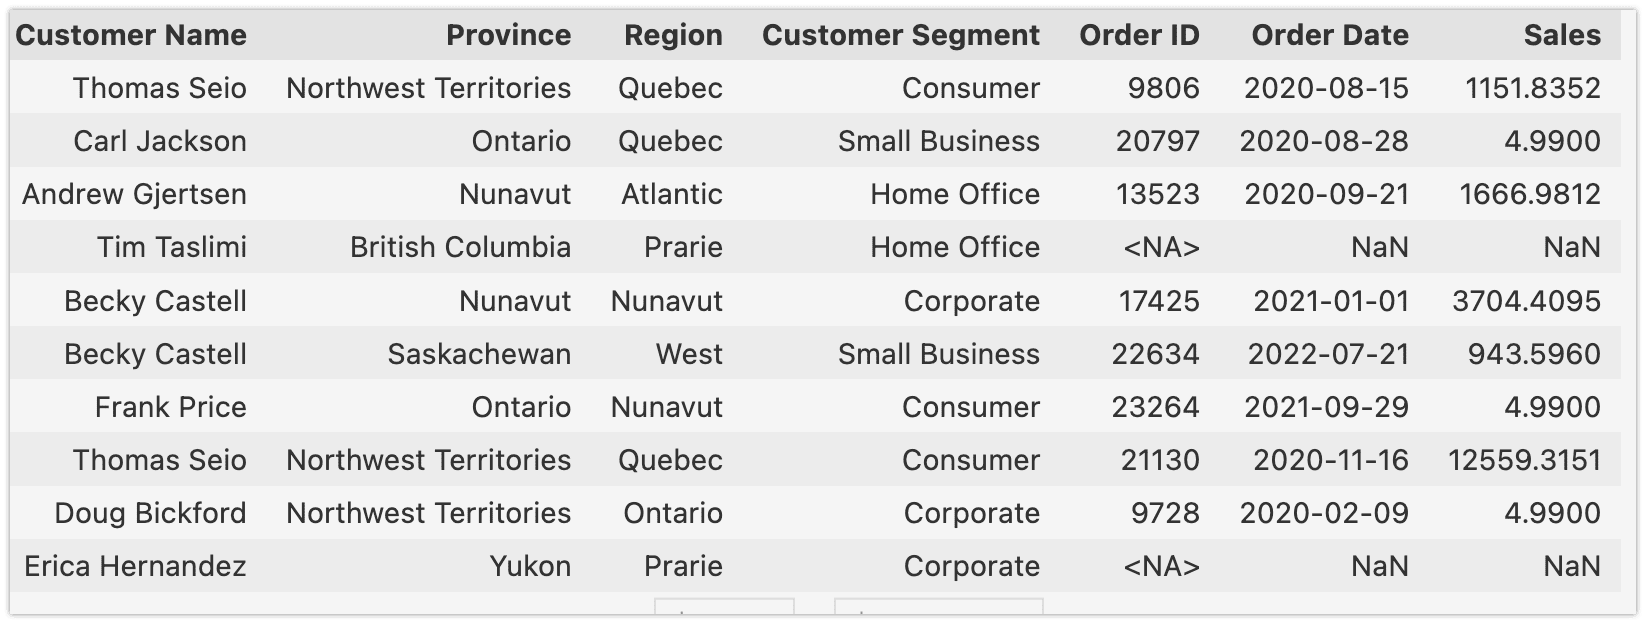
To conduct the Data Mart analysis, I will use a table based on Customer Name (customer_regional_sales):
Implementing Data Quality Checks in Great Expectations
For the purpose of this article, the following approach has been used:
- Keep data in 3 csv files
- Use Pandas for reading csv
- Use the Great Expectations method from_pandas for converting Pandas dataframe.
import great_expectations as gx
import pandas as pd
df = pd.read_csv('./data/customer_regional_sales.csv',dtype={'Order ID': 'Int32'})
df_ge = gx.from_pandas(df)
This is a good demonstration of Expectations for each dimension.
Great Expectations evaluates data with Expectations. Expectations are statements expressed in a declarative manner that can be assessed by a computer, but also carry meaning for human interpretation. GX has 309 Expectations, and you can implement custom expectations as well. All expectations can be found here.
Completeness
Completeness is a dimension of data quality that measures whether all expected data is present in a dataset. In other words, completeness refers to whether all required data points or values are present in a dataset, and if not, how many are missing. It is also important to check if the column exists at all.
GreatExpectations has a specific Expectation for checking completeness:
expect_column_values_to_not_be_null — expect the column values to not be null.
In order for values to be considered as exceptions, they must be clearly null or missing. For example, a NULL in PostgreSQL or an np.NaN in Pandas. Simply having an empty string is not enough to be considered null, unless it has been transformed into a null type.
It can be applied for our use case:
df_ge.expect_column_values_to_not_be_null(
   column = 'Customer Name',
   meta = {
     "dimension": "Completeness"
   }
)
Uniqueness
Uniqueness is a dimension of data quality that refers to the degree to which each record in a dataset represents a unique and distinct entity or event. It measures whether the data is free of duplicates or redundant records, and whether each record represents a unique and distinct entity.
expect_column_values_to_be_unique — Expect each column value to be unique.
df_ge.expect_column_values_to_be_unique(
   column = 'Order ID',
   meta = {
     "dimension": 'Uniqueness'
   }
)
Next dimensions require more business context.
Timelessness
Timelessness is a dimension of data quality that measures the relevance and accuracy of data over time. It refers to whether the data is up to date. For instance, my requirement is that the data set should have records for the last four years. If the data set has older records, I should get an error.
For testing timelessness I use Expectation: expect_column_values_to_be_between
It will work, because I can parse the date and compare it.
import datetime


# Get the current date I use the start of the current year.
now = datetime.datetime(2023, 1, 1)
# Define the column to validate and the expected minimum date
min_date = now - datetime.timedelta(days=365*4)
# Create the expectation
df_ge.expect_column_values_to_be_between(
  "Order Date"
   min_value = min_date,
   parse_strings_as_datetimes=True,
   meta = {
     "dimension": 'Timelessness'
   }
)
Validity
Validity is a dimension of data quality that measures whether the data is accurate and conforms to the expected format or structure. Because invalid data can disrupt the training of AI algorithms on a dataset, organizations should establish a set of methodical business rules for evaluating data validity.
For example, in the USA birth dates typically include a month, a day, and a year, while social security numbers consist of ten digits. Phone numbers in the US begin with a three-digit area code. So it may be more challenging to determine a specific format for a birth date.
In my data set, the date column “Order Date” has the format YYYY-MM-DD, so I should check it for all values in the column.
GX has an Expectation for date — expect_column_values_to_be_valid_date. This Expectation is based on the method “parse” from dateutil.
If you need to check the length of the string, then you should use Expectation — expect_column_value_lengths_to_equal
It is a universal practice to use regex for my date format:
df_ge.expect_column_values_to_match_regex(
 column = 'Order Date',
 regex = '\d{4}-(0[1-9]|1[0-2])-(0[1-9]|[12][0-9]|3[01])',
 meta = {
   "dimension": "Validity"
 }
)
My vision is that most Expectations in the GX repo should be able to check the Validity dimension.
Consistency
Consistency is a dimension of data quality that refers to the degree to which data is uniform and accurate across a dataset. It measures whether the data is logically coherent and conforms to expected values, ranges, and rules. To evaluate consistency, I typically compare data values to known standards or values and check for discrepancies or deviations. Also, I use statistical methods to identify and correct inconsistencies in the data.
As an example for my dataset, I have created a rule that the “Sales” column, which represents the profit of each order, cannot be negative. Also, I know that the max sum is 25,000.
Great Expectations has the Expectation — expect_column_values_to_be_between, that fits it.
df_ge.expect_column_values_to_be_between(
   column = 'Sales',
   min_value = 0,
   max_value = 25000,
   meta = {
   "dimension": 'Consistency'
   }
)
Also, you can use expectations with statistical checks:
expect_column_mean_to_be_between
expect_column_stdev_to_be_between
Integrity
integrity ensures that the data is correct and valid, especially when it is used in more than one place. It involves checking that the data is accurate and consistent when it comes to connections between different datasets, and making sure that it follows the rules set by the business.
I have two sources and one dataset related to these two datasets. It means that I have to check that data was not lost when I made the transformation. For me, the most important param is Order ID. I want to be sure that all orders are placed in customer_regional_sales
Great Expectations has several ways to resolve it:
- Using Expectation — expect_column_values_to_be_in_set. It expects each column value to be in a given set. In this case, I need to compare Order ID from the “orders” data set with Order ID customer_regional_sales:
df_expectations = pd.read_csv('./data/orders.csv',
                               usecols=['Order ID'],
                               squeeze = True
                             )
df_ge.expect_column_values_to_be_in_set(
   "Order ID",
   value_set = df_expectations.tolist(),
   meta = {
     "dimension": 'Integrity'
   }
)
This Expectation will fail if the column customer_regional_sales.order_id is not equal to orders.order_id.
- Using the previous Expectation, but with the evaluation param. You can learn more about how it can be done in the official documentation.
- Comparing two tables using UserConfigurableProfiler. Check out how to do this in the official documentation here.
- Finally, if you want to check the integrity of your Change Data Capture, you need to use a Data Quality Gate. DQG allows you to deploy Data Quality with GX on AWS in one click. Read our case study on this solution on the AWS tech blog.
Conclusion
This article demonstrates how to implement data quality dimensions in your data using the Great Expectations library. By using Expectations to validate your data, you can ensure that it meets the requirements for a variety of data quality dimensions, including completeness, validity, consistency, uniqueness, and more. While I have covered a few examples, there are many other Expectations that you can use to meet your specific business needs.
By improving your data quality approach, you can avoid costly bugs and improve the accuracy and reliability of your data and the insights derived from it.
If you have any questions or suggestions, please feel free to leave a comment below or contact me directly on LinkedIn. Thank you for reading!
Aleksei Chumagin is an accomplished QA expert, and serves as Head of QA at Provectus. Aleksei has extensive experience in testing, programming, and team building. His strong data quality expertise makes him a valuable asset to the Provectus team. Aleksei is an active contributor to the Great Expectations community.