It’s been a subject for debate for as long as I’ve been working on online basemaps… Why does it always have to be Web Mercator? Well, in fact, it doesn’t!
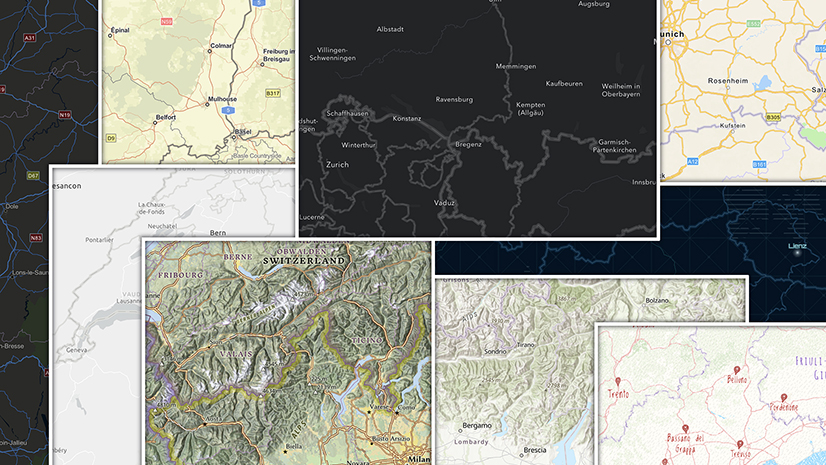
Most of the basemaps that we build (as with Google, Bing, and most other providers) use Web Mercator. For better or worse, the standard has been set, and our work is an acknowledgement of that. But we also provide a GCS version of many of our maps, and John Nelson and I have both done some experimenting with the Equal Earth projection. I included this in a Story Map about vector tiles and ArcGIS Pro in 2021.
Building and maintaining multiple map projections at a full range of scales can be a heavy lift, involving gigabytes of data. Fortunately, unless you have a specialized requirement, most of the practical need for other projections is at small scale. Larger than about 1:1,000,000 the projection really doesn’t have any visual impact on what you are doing. That makes things a bit simpler, because a vector tile package restricted to smaller scales is not going to be too big – You can consider building something yourself. All you really need is a decent source and the willingness to do a bit of preparation.
So, with that in mind, I set out to put something together.
Here are some links to the ‘Human Geography’ style basemaps I created:


The Source
I used ArcGIS Data and Maps. It’s available to most of us, and it was a chance to prove that you don’t have to access anything too sophisticated to get a result. It needed a bit of preparation though, and this is where the bulk of my time went. I decided to create a style based roughly on the Human Geography basemap. So, working in ArcGIS Pro I collected the features I thought were relevant, created polygon, line and point features where necessary, and did some clean-up.
Preparing the Map
At this point there was a decision to make. Do I style the map completely in ArcGIS Pro, or create the vector tile package and finish the styling online? I could have done it all in Pro, but I decided on the latter for these reasons:
- It made sense to keep the vector tile package as simple as possible. Multi-line symbols (such as roads) can be added later in the JSON code.
- The styling options available to me in the JSON work differently to those in Pro, and I can get a finer result finishing online.
- I wanted to create multiple different projections, and there was a possibility I would need to make custom changes to the style JSON anyway.
So, the decisions to be made were more about the structure of the final package: Keep the number of layers to a minimum. Set scale ranges for individual features, but be generous with them so I have some flexibility later.

Maximum Scale
Each scale quadruples the number of tiles generated over the previous scale, so this is no small matter. I decided to stop at Zoom 9 /1:500,000 approx. This begins to get into the sort of content we show at larger scales, roads in particular.

Fonts
This one needs to be thought-out. The Style will only work with fonts that are included in the vector tile package when it is created. It’s important that you include all faces/fonts that you need at least once in the map. In my map I was focusing on Avenir Next, so I included all variants I felt I needed on different features, even if I planned to switch them later.
Icons and Patterns
These can be added/substituted later using the Vector Tile Style Editor (VTSE), but it’s not a bad idea to establish the ones you know you need in the tile package. It saves you having to build them again if you decide to create other styles. In my case, the only ones I used were simple road shields.
Publishing the Master Maps
I built one master map in my Pro Project, then copy/pasted the layers into 4 separate maps, one for each projection. Each was then used to create a Vector Tile Package, published to my ArcGIS Online account. The packages were slightly different sizes, but they were all around 120-140 MB. Once they were available online I opened them into the VTSE and saved new style layers for each of them.
Finishing the Styling
I opened one of the new maps into the VTSE and refined the style, changing scale ranges, adding duplicate layers, and adjusting line widths color and font. Once I was happy, I opened the other projections into the VTSE, switched to ‘Edit JSON’ and used copy/paste to insert the adjusted code into all of them. Finally, I checked through the zoom levels of the maps to make sure everything was working.
Final Layers
The ‘Human Geography’ model requires the map information to be split into three layers (base, reference and label). To make things easier, I built one combined layer at first, then split the information up afterwards.
I ended up with 16 layers – A combined style, plus base, detail and label layer for each of the four projections.
Having got the basemaps established I can adjust the styles in any way I see fit. I used the VTSE to change some colors and create the graphics at the top of this blog, and here is a single-layer color version of the Goode Homolosine basemap:

Establishing a Web Map
You will not be able to add your new projected layers to an existing ArcGIS Online map.
- Open a new map, then look for one of your new layers.
- Make sure to choose the ‘Use as Basemap’ option. This will replace the default (Web Mercator) basemap with your new projection.
- Add any other layers you require, and organize them accordingly.
*****
So Web Mercator is not going away, but it doesn’t have to dominate everything you do. Think carefully about the scales at which you will need to have a basemap available. If you feel that your users can get away without zooming right in, consider building something new. Choose your projection, and have at it!
My sample projected basemaps are creative prototypes, but they are available for you to use with your maps (They are also available in the ArcGIS Living Atlas). Of course, you are free to make adjustments to a copy of my map styles, or use them as a starting point for anything else you may want to do. For as long as I host the projected tile packages your maps will be available online. I’m not planning to take them offline any time soon (and I’ll give plenty of notice if I am), but if that concerns you, consider making your own.
Thanks to Esri’s David Asbury, who approached me about building basemaps in different projections, and got me thinking about it again.


Article Discussion: