If you are reading this you’ve hopefully already familiarized yourself with the Fundamentals of Synthetic Aperture Radar (SAR) and know how to add SAR Satellite Data to your ArcGIS Pro map.
Now comes the fun part! You are ready to learn all about the geoprocessing tools in the ArcGIS Pro Synthetic Aperture Radar toolset. With the Image Analyst license, you’ll have access to this toolset which is found in the Image Analyst toolbox. This toolset is the spice and everything nice that makes processing SAR Ground Range Detected (GRD) Level-1 data a piece of cake! Although Level-1 data has gone through some processing, it is not quite sufficient for analysis. Thus, Level-1 data must be processed even further before it can be used for visualization or analysis.
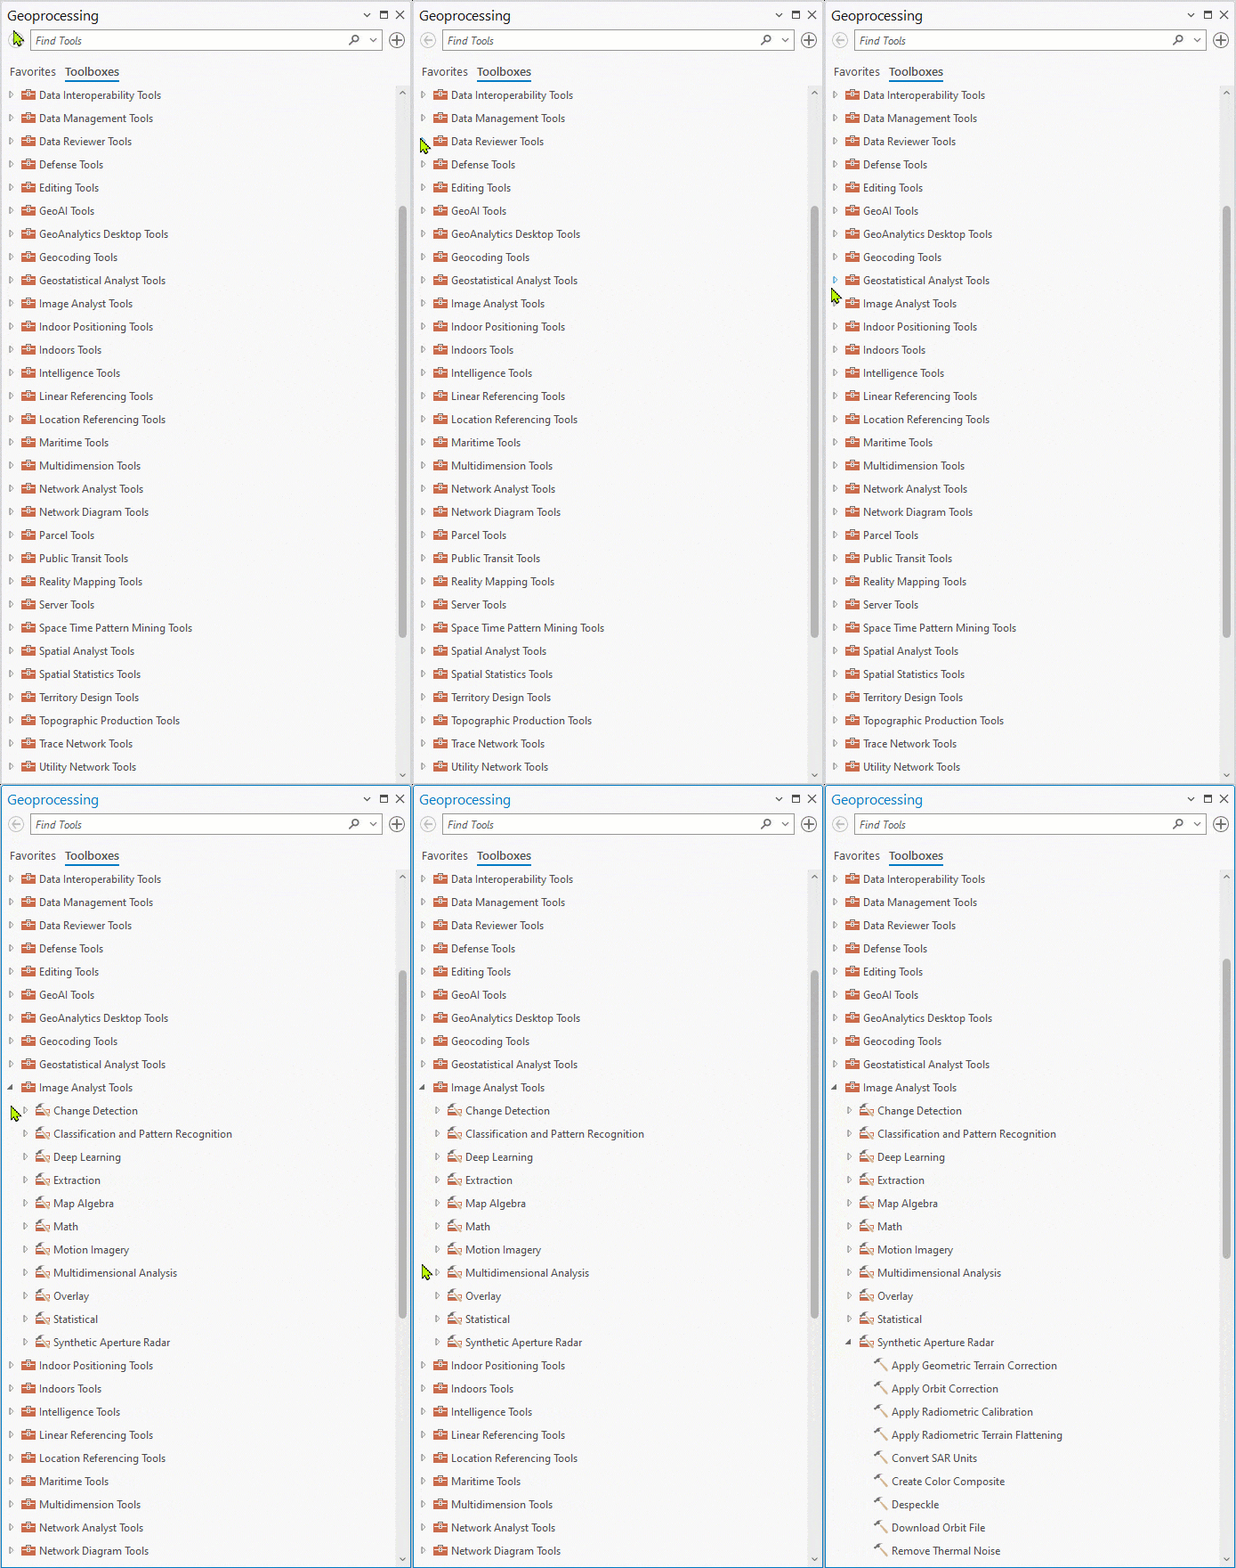
The aim of processing is to improve the SAR data by removing unwanted noise, distortions and enhance some image features important for further analysis. Issues that need to be addressed include updating orbit data, removing thermal noise, calibrating to retrieve a meaningful backscatter value, mitigating speckle, removing radiometric and geometric distortions, and rendering images with a large value range. Whew! Try saying that in one breath! It can seem like a lot, but don’t worry, this article will break it down for you! This processing is commonly referred to as Radiometric Terrain Corrections (RTC). The processing steps are sensor specific due to the available information in the metadata.
For further information, please visit the SAR workflows for supported sensors pages.
What’s in the Synthetic Aperture Radar toolset?
Download Orbit File and Apply Orbit Correction
Why it’s needed?
No matter how fine-tuned a satellite’s orbit may be, the location of the satellite will drift. This could be due to atmospheric drag and solar winds, Earth’s imperfect sphere from the non-uniform gravitational field, or other massive objects in the solar system that perturb the satellite’s orbit with their gravity. Because of this drift, periodic adjustments are needed to keep the satellite on the right track. So, it’s important to have the most up-to-date orbital files to get the precise location of the satellite.
How it works?
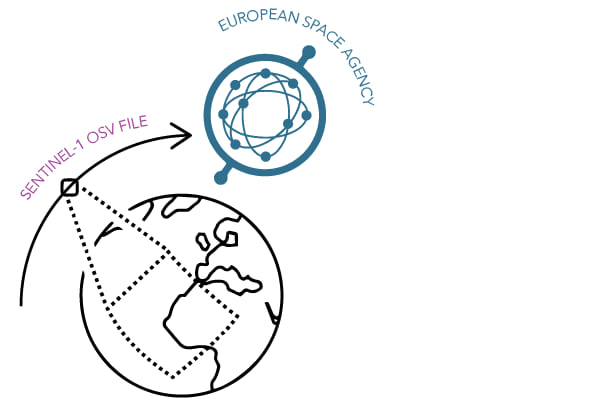
If you are working with Sentinel-1 GRD data you will use Download Orbit File tool to download the latest and most accurate orbit state vectors (OSV) file available from the Copernicus Data Space Ecosystem.
Using the SAR metadata, this tool identifies the appropriate Sentinel-1 OSV file and downloads it to the input SAR data directory by default or a specified folder location. The OSV file contains orbital information such as velocity and position of the satellite. Now that you have the OSV file, you’ll use the Apply Orbit Correction tool to update the orbital information in the SAR data.
To learn more about how to use these orbit tools, visit this page.
Remove Thermal Noise
Why it’s needed?
Thermal noise, or instrument noise is caused by microscopic motions of electrons due to temperature mostly from the internal circuitry of the satellite. Thermal noise is most apparent in areas of low backscatter such as permanent water bodies like the ocean and in cross-polarized scenes (VH or HV). Removing thermal noise is required to normalize the backscatter signal within the entire image, which is essential to both qualitative and quantitative use of SAR data.
How it works?
You will use the Remove Thermal Noise tool to correct backscatter disturbances caused by thermal noise in the input SAR data to get a more seamless image.
To learn more about how to use this tool, visit this page.
Apply Radiometric Calibration
Why it’s needed?
Radiometric calibration is necessary to obtain meaningful backscatter that can be related to the physical properties of features in the image. This is because Level-1 SAR data starts as uncalibrated digital numbers (DN) for pixel values. Once calibrated we can get the radar backscatter intensity. The backscatter intensity is the proportion of emitted signal striking the surface to the received signal reflected from it. We’ll go into more detail about this later in the Convert SAR Units section.
Radiometry or brightness of the backscatter intensity can vary. Therefore, radiometric calibration is important for normalizing these values to obtain accurate qualitative observations and quantitative measurements from the SAR Image. Additionally, this is an important tool to get the beta nought calibration that is required for the Radiometric Terrain Flattening step.
How it works?
You will use the Apply Radiometric Calibration tool to convert the input DN pixel values into radiometrically calibrated backscatter by using calibration parameters provided in the metadata and normalizing the reflectivity based on the specified reference plane. This tool performs three different calibrations for SAR datasets, including beta nought, sigma nought, and gamma nought. It’s good to note the differences between these calibration types, which can be seen in the figure below:
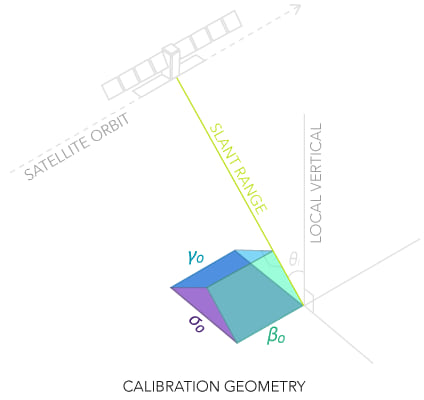
To learn more about how to use this tool, visit this page.
Apply Radiometric Terrain Flattening
Why it’s needed?
Due to the side-looking nature of SAR sensors, ground features facing the sensor appear artificially brighter and features facing away from the sensor appear artificially darker and can cause distortions. The Apply Radiometric Terrain Flattening tool normalizes the backscatter values so that value variations will be due to actual surface scattering properties of features in a SAR image over any terrain.
How it works?
You will correct the input SAR data for radiometric distortions due to topography by using the Digital Elevation Model (DEM) to estimate the local illuminated area and the local incidence angle.
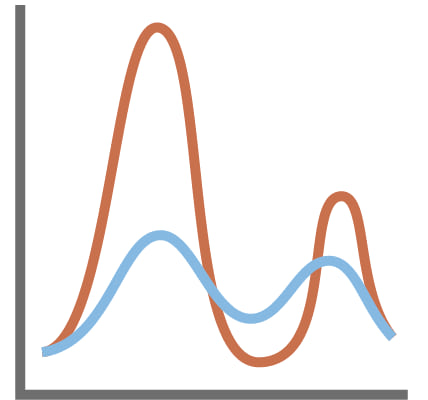
Note: For improved results you can input a higher resolution DEM.
To learn more about how to use this tool, visit this page.
Despeckle
Why it’s needed?
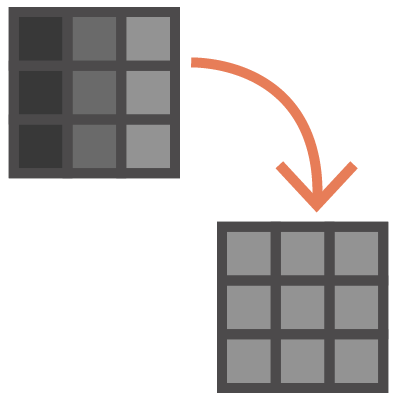
Speckle is a result of the coherent illumination and resembles a grainy or salt and pepper effect. You will correct the input SAR data for speckle by using the Despeckle tool. The backscatter recorded for a single pixel is the result of the radar wave interacting with multiple distributed targets within that pixel of the ground scene. When those interactions interfere constructively, they form a bright pixel. When they interfere destructively, they form a dark pixel. Shades of gray correspond to interference that’s neither fully constructive nor destructive.
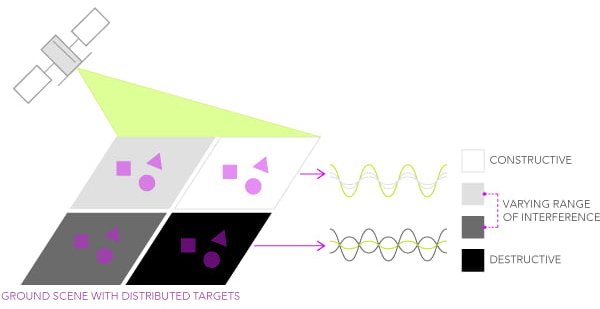
The figure above illustrates how the targets in the white/light grey pixels interfere constructively producing a brighter reflection and how the targets in the black/dark grey pixels interfere destructively producing a darker reflection.
How it works?
The Despeckle tool removes speckle by using one of the following filter types – Lee, Enhanced Lee, Refined Lee, Frost, Kuan, and Gamma Map, and specifying the filter size. Different filter sizes greatly affect the quality of the processed images. With a filter that is too small, the noise-filtering algorithm is ineffective. With a filter that is too big, subtle details of the image will be lost. Explore the filters and parameters to see what works best for you! To learn more about each of the filter types, read the parameters section in the help documentation.
To learn more about how to use this tool, visit this page.
Apply Geometric Terrain Correction
Why it’s needed?
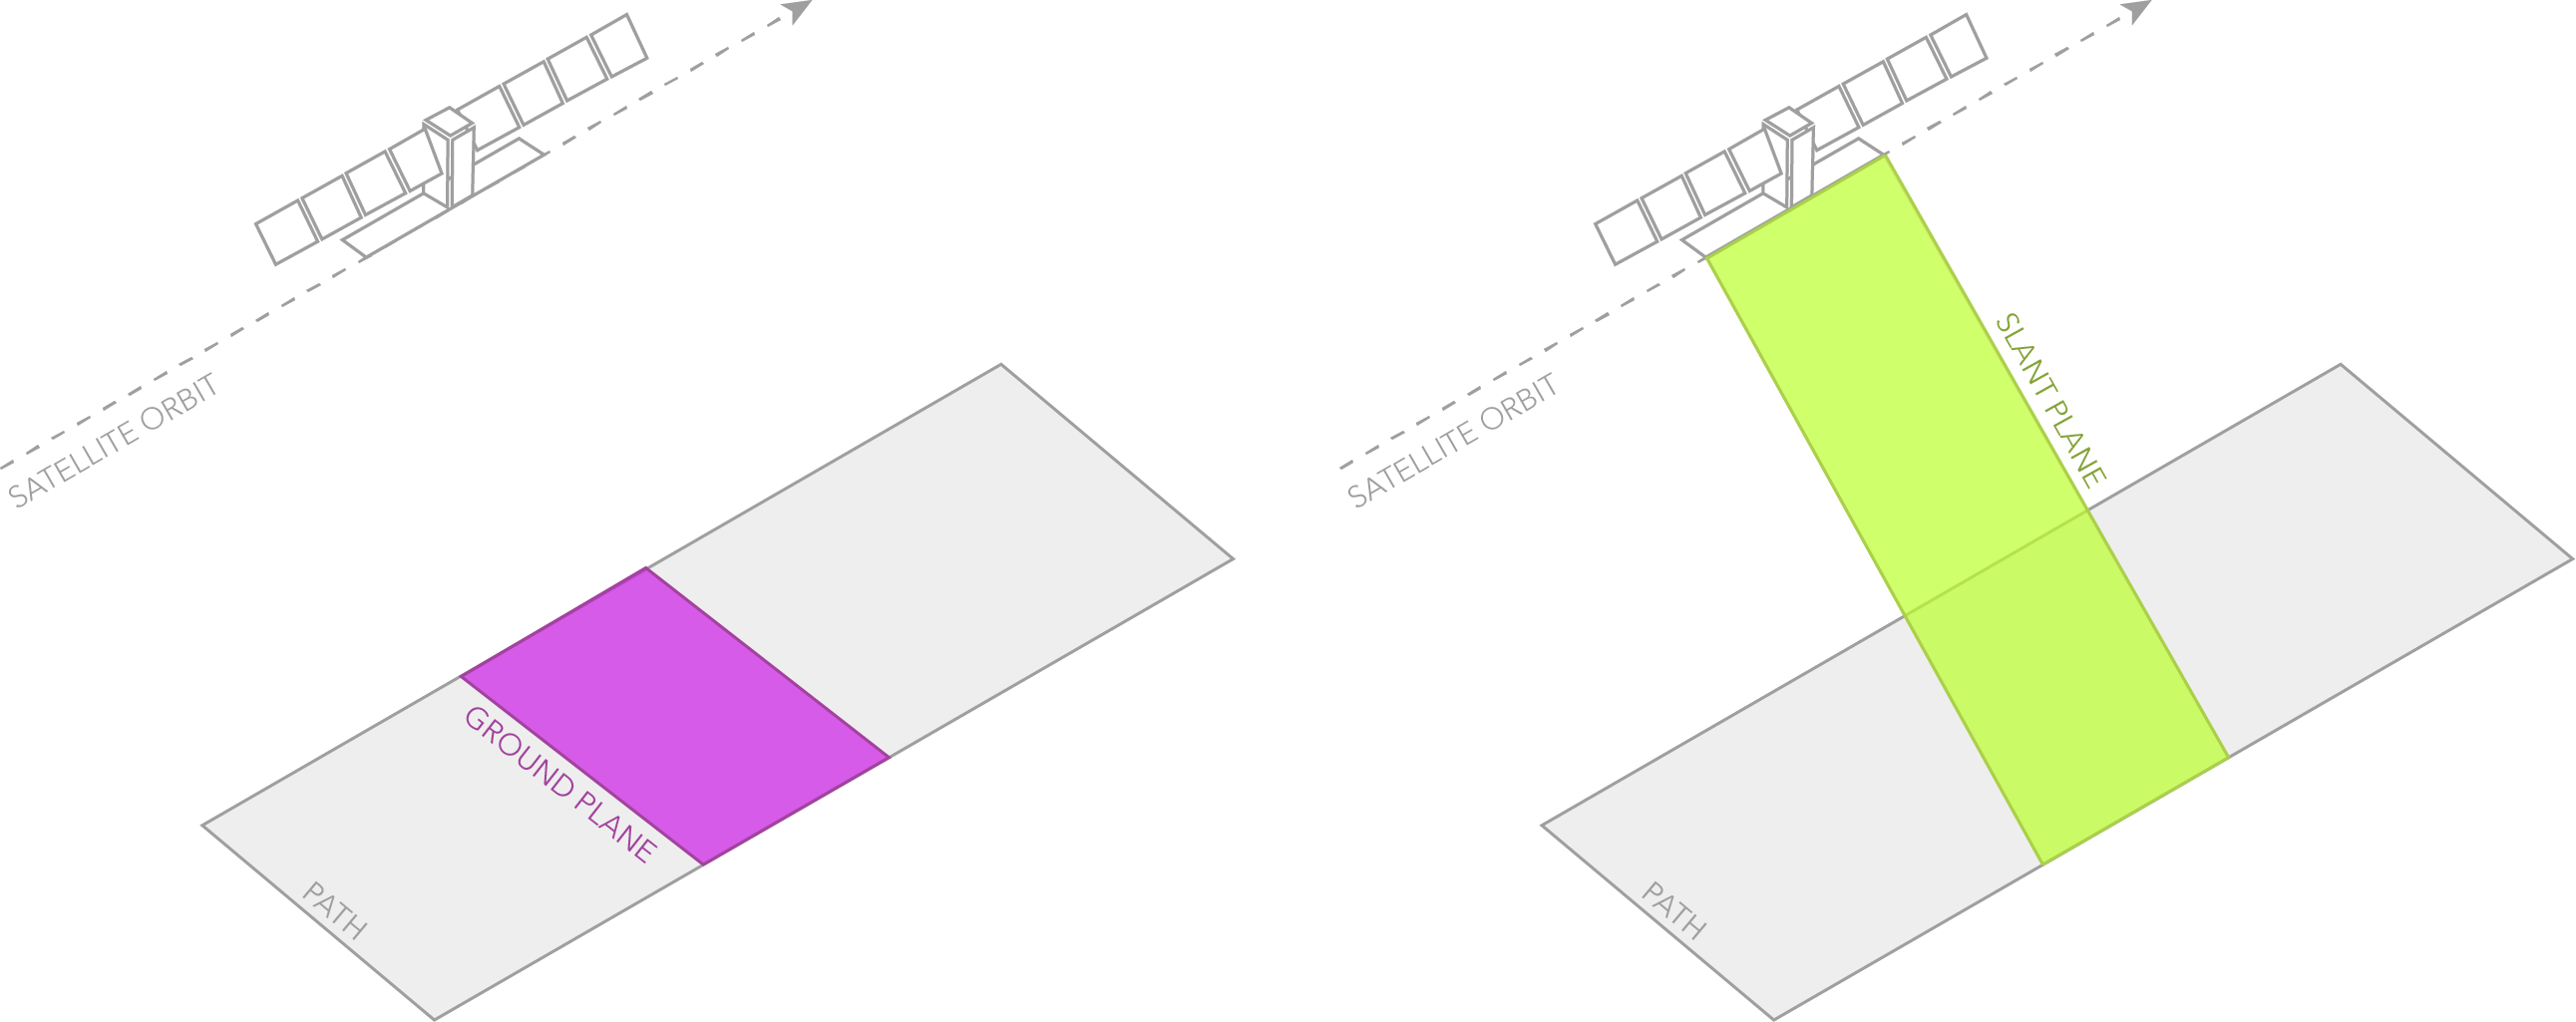
Since a SAR image is side-looking and acquired in a slant plane, this is needed to correct geometric distortions and accurately orthorectify the input SAR data. Orthorectification is the process of correcting apparent changes in the position of ground objects caused by the perspective of the sensor view angle and ground terrain. You will do that with the Apply Geometric Terrain Correction tool.
How it works?
SAR imagery has an amazing amount of information, but it cannot be used in ArcGIS Pro for GIS analysis until it has been processed such that all pixels are accurately converted to cartographic coordinates (latitude, longitude). Level-1 GRD products consist of SAR images that have been multilooked and projected to ground range using the Earth ellipsoid model WGS84. Since, a GRD product only accounts for the Earth ellipsoid model and does not consider the terrain we need to correct for this.
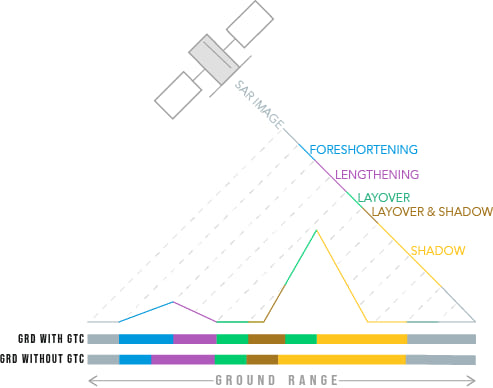
When you first load a SAR image in ArcGIS Pro the ellipsoid model from the SAR metadata is used to estimate the approximate location of the image also known as a geocoded ellipsoid correction. You will use the same DEM to correct for geometric distortions that you did for the radiometric distortion correction to orthorectify the input SAR data.
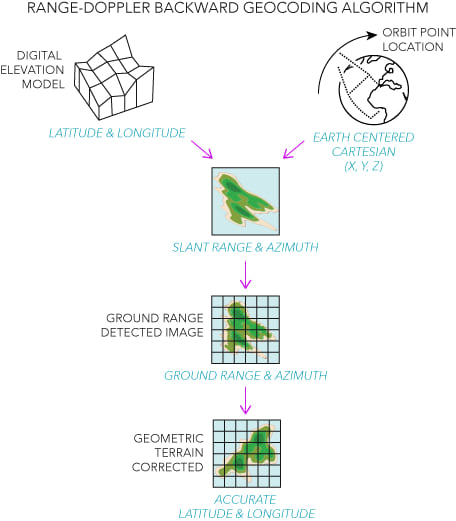
For proper SAR orthorectification, it is essential to have an accurate terrain model and an accurate description of the sensor model. The sensor model details are found in the metadata and contain information about the sensor location and orientation for every image. To orthorectify the input SAR GRD data, the geoprocessing tool uses the Range-Doppler Backward Geocoding algorithm for every pixel. This means it loops through each latitude and longitude pixel using the DEM and orbit point location to compute the slant range and azimuth, next calculates the ground range, and then interpolates the radar backscatter location from the input SAR GRD data to generate a geometric terrain corrected image with accurate latitude and longitude coordinates.
Note: It is advised to specify a DEM whenever land features are included in the radar scene. If no DEM is specified or in areas that are not covered by a specified DEM, an approximated DEM, interpolated from metadata tie points, will be created. The tie-point approach is used for full ocean radar scenes only.
To learn more about how to use this tool, visit this page.
Convert SAR Units (Linear To Decibels)
Why it’s needed?
The last part of the recommended RTC workflow is to covert the scaling of the input SAR data from linear to decibel (dB) units. Although this part is optional, we recommend performing this step because the dB system is a convenient way of manipulating and visualizing large numbers and large dynamic range. Thus, by converting the units to dB you will simplify interpretation and improve the image display by reducing the range of amplitude or intensity values through the conversion to a dB value. After the conversion, the positive dB values will represent backscatter towards the sensor and negative dB values will represent backscatter away from the sensor.
How it works?
Given that the radar backscatter in linear units is a power ratio between the received signal in and the emitted signal out, the Convert SAR Units tool, can convert the scaling of the input SAR data from linear to decibel units using the following simple, yet powerful equation (pun intended) seen in the figure below:
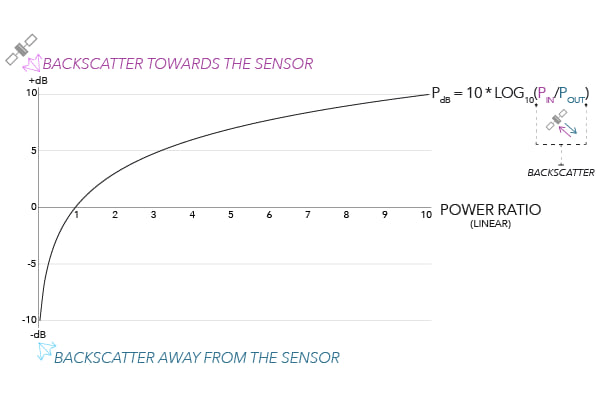
After the conversion, the positive dB values indicate backscatter towards the sensor for when the received signal in is larger than the emitted signal out and conversely negative values indicate backscatter away from sensor when the emitted signal out is larger than the received signal in (this can be seen in the graph above).
To learn more about how to use this tool, visit this page.
Takeaways
Understanding the Fundamentals of Synthetic Aperture Radar and adding SAR Satellite Data into your ArcGIS Pro map is just the beginning. With ArcGIS Image Analyst for ArcGIS Pro, you gain access to powerful geoprocessing tools in the Synthetic Aperture Radar toolset. This toolset is essential for transforming SAR GRD Level-1 data into RTC data that is ready for analysis. The recommended processing steps aim to enhance SAR image by eliminating noise, distortions, and improving important image features. By mastering these geoprocessing techniques, you’ll be able to unlock the full potential of SAR data for your analysis and visualization needs!
Resources
Want to see examples of these tools in action? Visit the story about the SAR Toolset.
Want to try it yourself now? Visit the Learn Tutorial, Process Sentinel-1 SAR data.



Commenting is not enabled for this article.