

Do you get overwhelmed when your data team rambles on about correlation, causality, A/B testing and other terms? Or you are a manager with some projects that include statistics and machine learning and you feel that you should contribute more on guiding your team to the correct outcome?
These types of situations are common for business and non-technical users. A data science project should have a diverse team and it is completely normal that some of the stakeholders are not completely familiar with some DS concepts that are key to the project success.
So.. welcome to the Basic DS Concepts series! In this series of posts, we are going to approach some of the basic principles about data science. These posts aim to smooth your learning curve, helping you understand some of the core principles behind DS, without getting too technical.
In this first post, we are going to talk about three important pieces: correlation, causation and statistical testing.
Let's start with some intuition on why a solid experimentation and statistical testing may be needed for your company. Historically, two types of mistakes have been done by companies when it comes to decision making:
- Decisions supported by wrong or biased intuition.
- Decisions supported by wrong, innacurate or out of context data.
The truth is, a lot of businesses (especially traditional ones) tend to make decisions based on feeling first (1) - only recently were companies faced with the hard reality that data-oriented businesses are thriving in this millenium. On the downside, this induced a panic frenzy into data related projects that may lead to conclusions that, although "supported" by data, can lead to poor results (2).
We can even go to back in time to see these mistakes being done throughout history. The launch of the New Coke was based on data and this was on 1985. Was the right data? Not so. Mostly because New Coke was launched based on positive blind taste tests but the decision did not take into account the loyal drinkers' emotional attachment to the brand and tradition.
Nowadays, most companies have probably around 1000 or 10000 times more data than Coca-Cola had in 1985 - does that make it easier to avoid such mistakes? Not quite.
So the question unfolds - how do I, as a business, embed data into the most important business decisions?
Let's start with one of the oldest adages in Data Science and Machine Learning.
Correlation is not equal to Causality
This is a widely used mantra for data scientists and statisticians around the world.
Have you ever looked at a correlation (two variables that move in the same direction) and immediately jumped into a conclusion? That's normal and don't feel too bad about it. Even the most experienced data professionals commit this blunder from time to time as human beings try to find patterns and logic even in the most random of processes.
Certain correlations that may imply causation almost became urban legends. Spurious Correlations is the place to go to find the most outrageous ones. For instance:
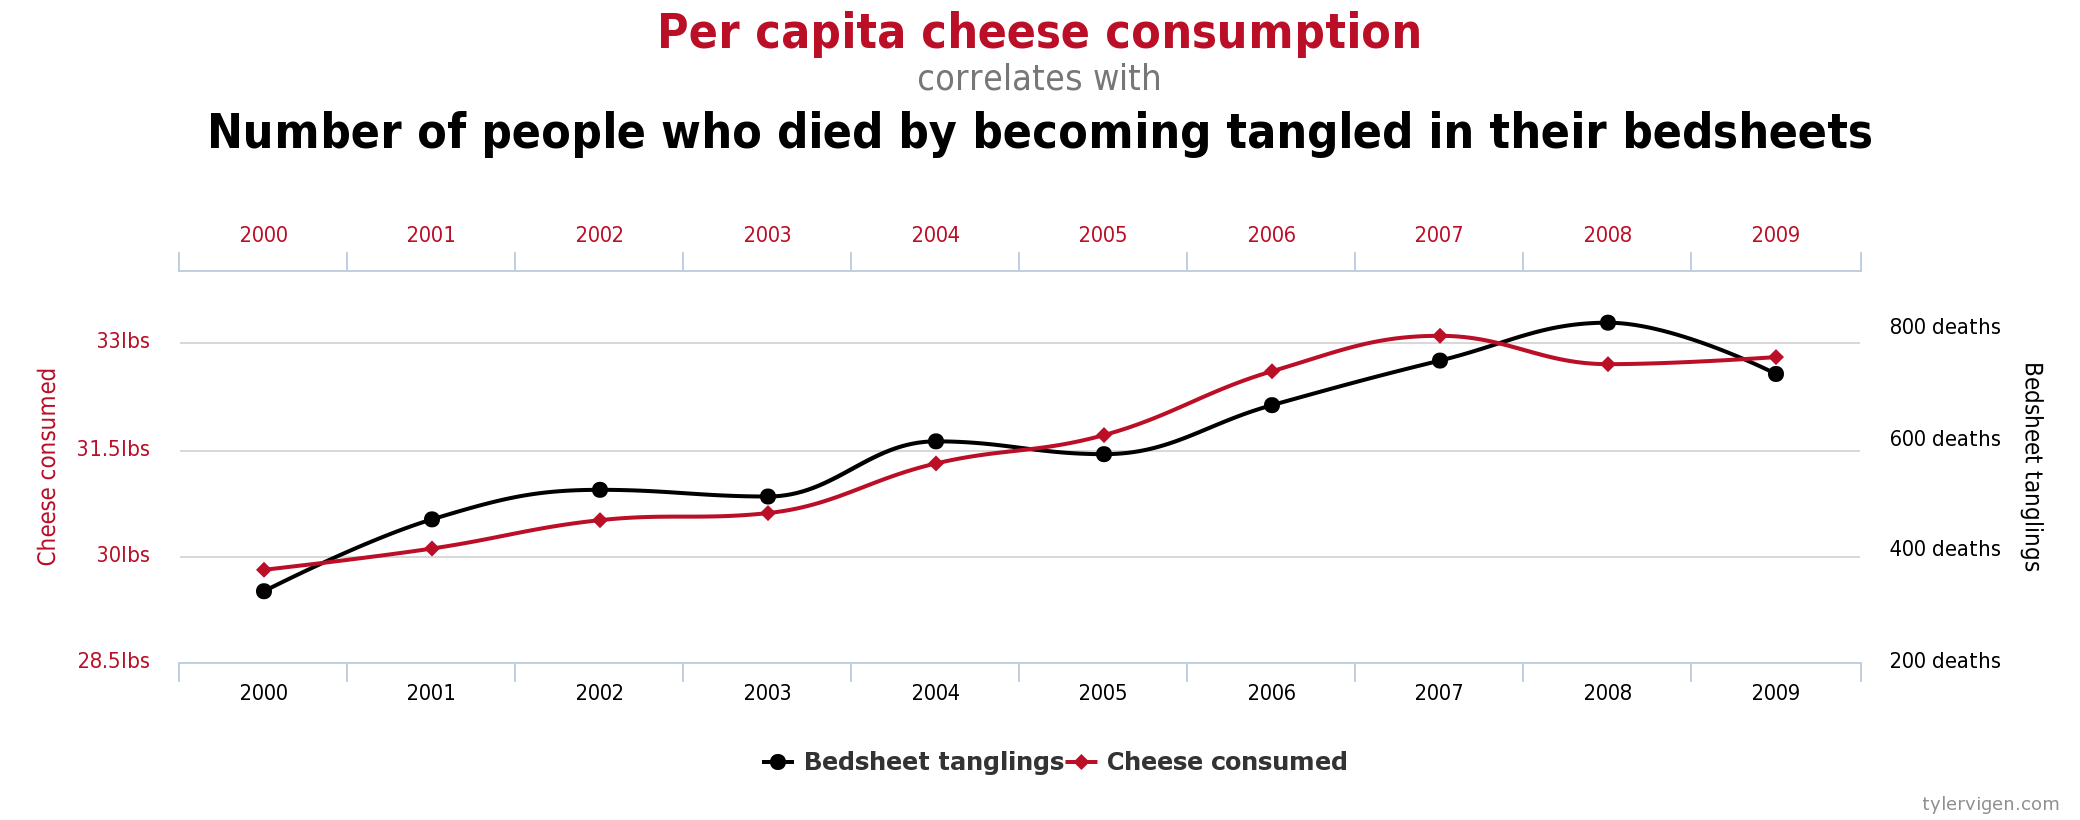
When you say it out loud, it even sounds more ridiculous. But indeed, for the data available (2000-2009) there is a really high positive correlation between the per capita consumption of cheese and the number of people that died by becoming tangled in their bedsheets.
Do you immediately jumped to the conclusion that people got tangled in their bedsheets because they ate more cheese? Or the reverse? People ate more cheese in the afterlife after dying from getting entangled in their bedsheets?
Either way, those are ridiculous statements as there is no cause-effect connection between both.
These types of relationships are normally called spurious relationships. In the former example, it's easy to spot it as it's extremely hard to convey a causal relationship between the variables.
But now substitute the outrageous example above by the following two variables Number of App Downloads and Number of Buttons in the App with Red Color:
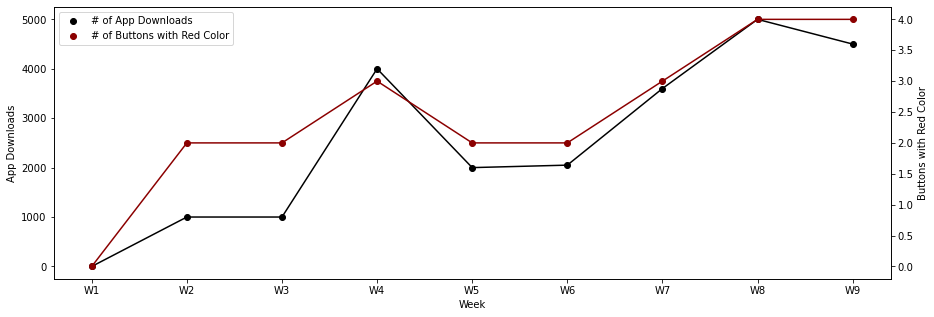
If you are in a meeting and you show the plot above, many people will assume that adding buttons with red color will lead to more app downloads. Someone will definitely find a thesis that seems logic and will present an argument for the causal relationship between the changes in the app and the number of users that have downloaded it.
That probably isn't true. And that may have two reasons:
- There may be some factors that you don't take into account here. What if a competitor's app was removed from the App Store? What if, at the same time, your marketing team has done an aggressive marketing campaign to pump up the number of downloads? There are just too many things outside of your control. Even with a high correlation, you can't assume that the increase in red buttons is the root cause of the higher number of downloads.
- Good ol' randomness might come into play. Yes, the results you are seeing may be purely random.
Generally, we end up finding a third variable that causes one or more of the variables from the relationship, falling into the first example above.
In the case above, you end up discovering that your marketing team had a big campaign prepared for the third and fourth week of the year. That caused some pressure on the development team to speed up app developments (where changing the color of the buttons was one the deliverables). So the marketing campaign is what we normally call a confouding variable.
This variable is something that may cause the direction and movement of the two variables you are analyzing.
Let me also give another example. This is a story that is a standard in Data Science and Econometrics classes:
Ice cream sales and drownings are extremely correlated and display a seasonal trend.
One wouldn't think that these variables cause each other. We all know that there is a third variable lurking somewhere in the background that will justify the fact that both of these variables move in tandem:
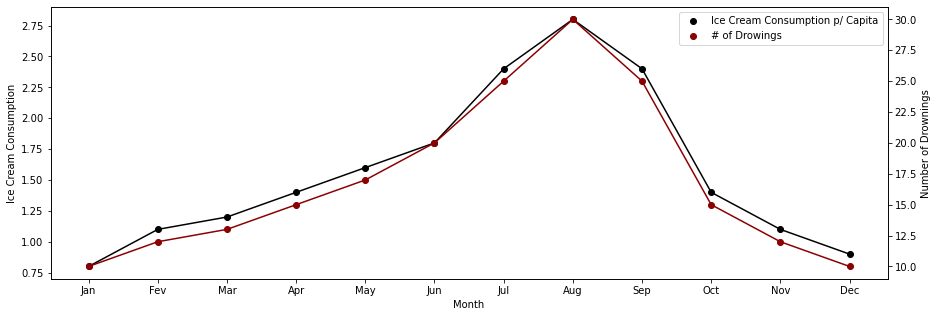
And we know what's the third one...
The average temperature!
So, as the temperature goes up, so does ice cream consumption. And also, the number of drownings! This causal relationship seems to make much more sense in terms of intuition. In this example, it was easy to spot which variable might be causing what we are measuring. In business setting that is really quite hard and the confounding variables can be almost infinite.
Luckily, there are a couple of techniques and standards in the industry to ensure that we are not being tricked by correlation.
A/B Testing
Repeat with me: A/B testing (Commonly called so in digital businesses) or Target/Control (Commonly called so in traditional businesses) is one of the few ways to ensure that we are looking at causal relationships.
It's actually a quite simple logic:
- You select a sample where you will apply some treatment or where you want to see some effect - commonly called target/test group.
- You select a sample that you will not apply any change - commonly called control group.
This technique is applied in several industries:
- In Pharma, this is a widely used approach to check the safety and efficiency of a drug (although in the context of pharma the control group is given a placebo so some alternative "treatment" is applied due to pacients' perception bias)
- In Retail, when you want to launch a new product a Target/Control experiment can help you to understand how the product will be perceived and received by the market in terms of taste, brand and other characteristics.
- A company that develops apps uses A/B testing to understand if changing a color of a button improves the ratio of users that click the button.
As we've seen with the New Coke example, designing a good experiment is hard and requires knowledge of the business or research goal. Here is a small checklist to cover when you want to design a study/experiment as such:
- Know your objective with the study. What you want to measure is extremely important and must be aligned with business or research goals.
- Ensure that both target and control samples contain similar characteristics. As an example, if you are testing the efficiency of a drug, you want to guarantee that you have all the age groups in both samples so that you are able to compare the outcome in a statistically relevant way. If one of your samples is too skewed toward a younger or older age group, this may lead to biased results.
- Start small with a large enough sample size. Ideally you would like to begin your experiments in a POC environment (check out this post for more!) If you don't know the underlying population distribution, try to at least incorporate 3 to 5% of your population in the tests so that you are confident in the results. If you know that the underlying phenomenon you are trying to study is roughly normally distributed you can aim for a lower sample size.
- Design the best possible hypothesis. Your data science workflow has to be prepared to set up good hypothesis for testing. If you want to get prescriptive, your hypothesis has to be connected with past data and the action must be reproducible in the future.
After the study, you can probably develop a cause-effect intuition on the underlying phenomenon. At this point, you can jump from your model/hypothesis to a prespective action.
From ML Models to Prescriptive Actions
For projects that are interested in causality, one of the best skills that an Analytics and Data Science team can have is to be able to design well thought hypothesis that will be used for A/B testing.
Some examples of projects that can be solved when causality is met:
- Should I launch my product in some specific region first?
- Should I change the communication of my marketing campaigns according to the channel?
- What types of incentives work best for my commercial team?
- How many menus should I display on my website?
- What should be the color of my app's background?
Most machine learning algorithms are able to predict something based on correlation - for example, if you know the amount of ice cream consumption you might be able to predict the number of people that drowned - does that translate into a cause-effect relationship? Absolutely not and one shouldn't decrease the amount of ice cream consumption to save people from drowning.
But a machine learning algorithm will definitely pick up this correlation. In most business settings you can bet that relationships like this will show up. If you were to build a prescriptive analysis based on this, that would be completely off the target.
Causality is the only thing that will enable you to make prescriptive decisions.
Conclusion
Correlation, causality and experimentation are some of the essential building blocks when it comes to embed data into your company's decision.
When you first start to address them, these concepts seem a bit cumbersome to grasp. They are definitely not first nature to everyone, particularly if you don't have a statistics background. But, probably, there will be a ton of opportunities where you will identify these principles and how they can be applied in your daily life.
In the future, we will also approach other DS building blocks, such as:
- Supervised vs. Unsupervised learning;
- Basic statistics and what do they mean;
- Data distributions;
- Regression vs. Classification;
If you have any feedback or you are interested in discussing some of these topics, feel free to drop me a message at ivo@daredata.engineering or via LinkedIn.
Thank you for taking the time to read this post and I hope you found it enjoyable.
DareData has been working closely with businesses when it comes to embedding prescriptive actions from ML models. Additionally, we are experts in supporting the right Data Engineering and ML Ops, enabling your data science models to scale from experiment state safely (if this rang a bell in your mind, you should definitely check this out!).