
DoorDash proactively embeds privacy into our products. As an example of how we do so, we delve here into an engineering effort to maintain user privacy. We will show how geomasking address data allows DoorDash to protect user privacy while maintaining local analytic capabilities.
Privacy engineering overview
To facilitate deliveries, users must give us some personal information, including such things as names, addresses, and phone numbers, in a Drive API request. This information is needed for Dashers to know where and to whom to deliver an order. Because this information can be used to re-identify an individual, it could be used by a bad actor to cause harm, including identity theft and doxxing.
That’s why we want to ensure that this personal data is redacted (erased or obscured) from our platform within a reasonable period of time after a delivery is completed. That way, even if a bad actor gains unauthorized access to our database, personal data will no longer be there, preventing it from being misused.
Merchant-defined policies
On DoorDash Drive, merchants can configure redaction policies about when personal data related to their orders will be redacted.
If a merchant does not configure such a policy, we will set a default time for redacting the data anyway. It will not be allowed to persist indefinitely.
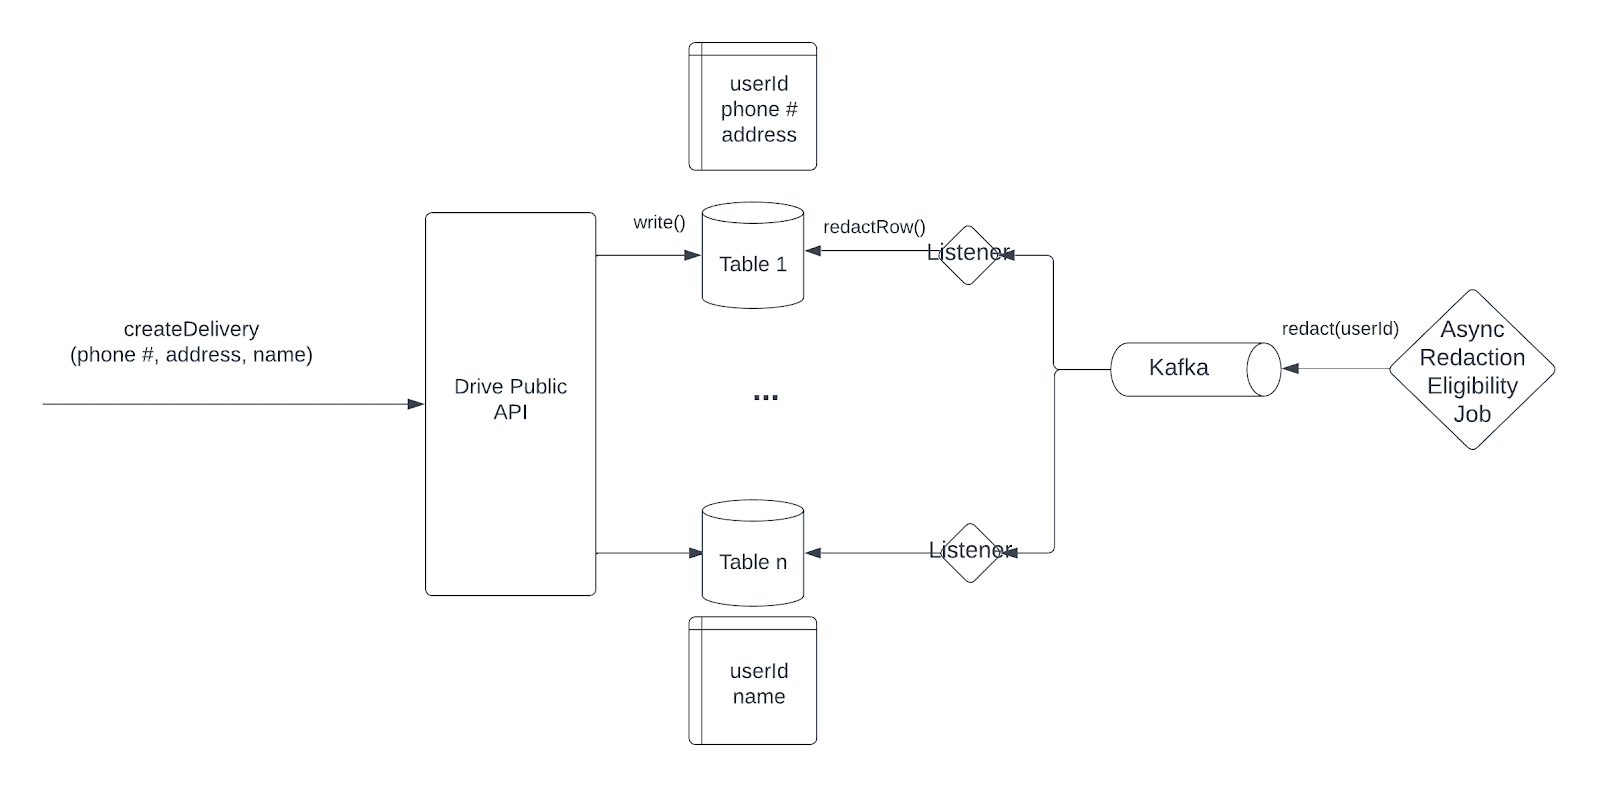
Asynchronous redaction
As is common practice in the industry, each user is associated with a unique user identifier. Personal data can propagate through many layers of a distributed system, so we associate instances of this data with an identifier.
As seen in Figure 1, an asynchronous redaction eligibility job combines various inputs to determine if a user is eligible for redaction, including merchant-defined policies, time at which drive orders were placed, and a mapping of where data has propagated. If the data is eligible for redaction, the job publishes a message to a Kafka topic, signaling to purge the data associated with this user. Each service that maintains a copy of this data will have a corresponding listener, which can kick off a process to redact the data from its tables.
Each process can be executed in parallel, bounding the overall redaction time to the longest individual process. The redaction is only considered successful after every process has signaled with a success acknowledgement.
Address geomasking
As an example, we can delve into a specific piece of data involved in the high-level flow, the user’s delivery address. In some cases, there is a false dichotomy between being able to protect sensitive personal information and being able to leverage the data for analytical purposes, including improving recommendations and generating valuable inferences. Address data, for instance, could be used to inform merchants where most of their orders are coming from or to help make recommendations to customers who are ordering from the same area. If we redact the data completely, we lose opportunities to improve our platform. Our challenge is to find a middle ground where we are able to effectively eliminate the risk of customer address data being misused while maintaining our ability to analyze location data to generate business opportunities.
Gaussian perturbation
To achieve that middle ground, we can transform into geographic coordinates — latitude and longitude — through a process called geocoding. As shown in Figure 2, we can then displace these coordinates in both direction and distance by a degree of randomness to mask the specific data.
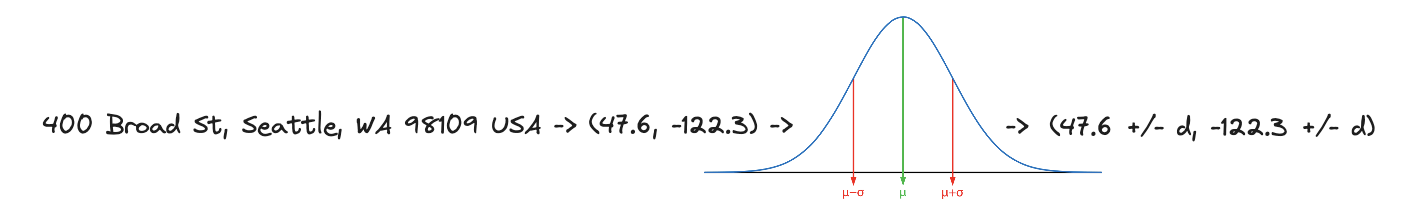
The distribution of these geomasked points follows a bimodal, Gaussian (normal) distribution. A regular Gaussian approach applies the same displacement to both latitude and longitude. A bimodal approach, on the other hand, applies different displacements to the latitude and longitude, which allows more precise control over the level of obfuscation and reduces the chance that the displacement is 0.
The new geomasked point can modeled by the following equation
(Xnew, Ynew) = (Xο + Dx * cos(𝛩), Yο + Dy * sin(𝛩))
Xo, Yo: the original lat/long coordinates
Dx: the distance that we are to displace the latitude, randomly selected from a Gaussian distribution with mean value 0 and standard deviation σx
Dy: the distance that we are to displace the longitude, randomly selected from a Gaussian distribution with mean value 0 and standard deviation σy
𝛩: the angle between the original location and the geomasked location — a randomly selected value from the range [0, 2π]
This allows us to fine-tune the standard deviation (σ) of the Gaussian distribution to protect user privacy while also maintaining a sense of the original delivery area and the opportunity for location analytics.
Twitter case study
This process has been studied using Twitter location data as shown below in Figure 3:
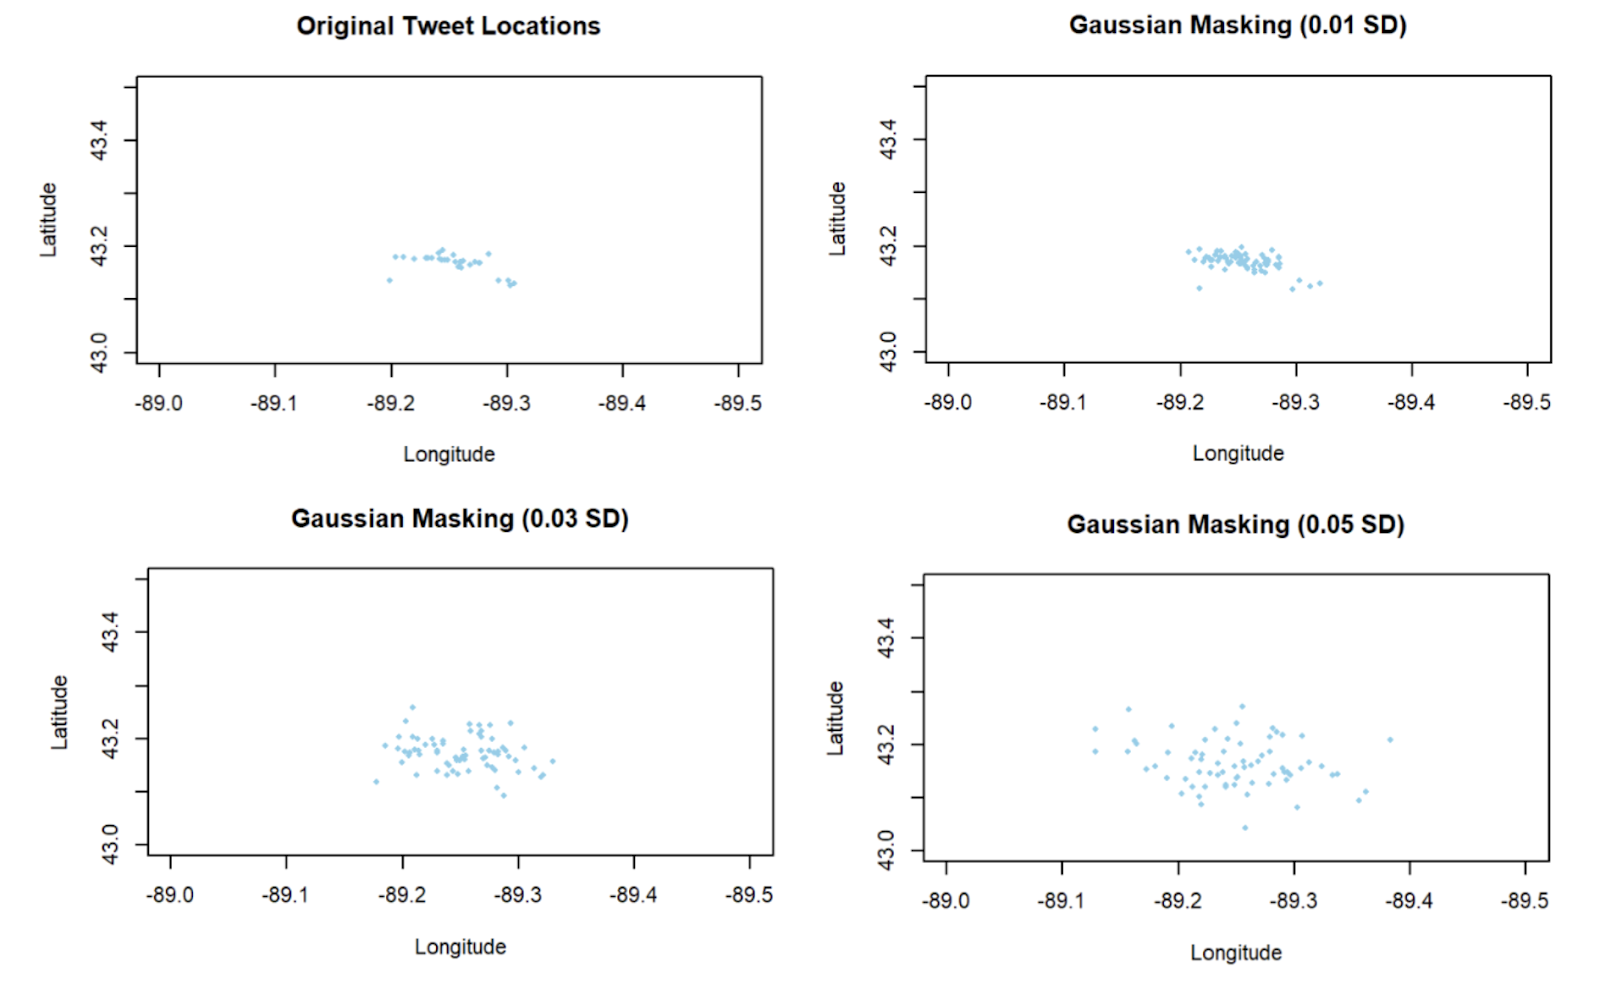
As the standard deviation increases, the cluster of tweet locations becomes more sparse, making it harder to pinpoint where the tweets originated.
Subscribe for weekly updates
Quantifying geomasking effectiveness
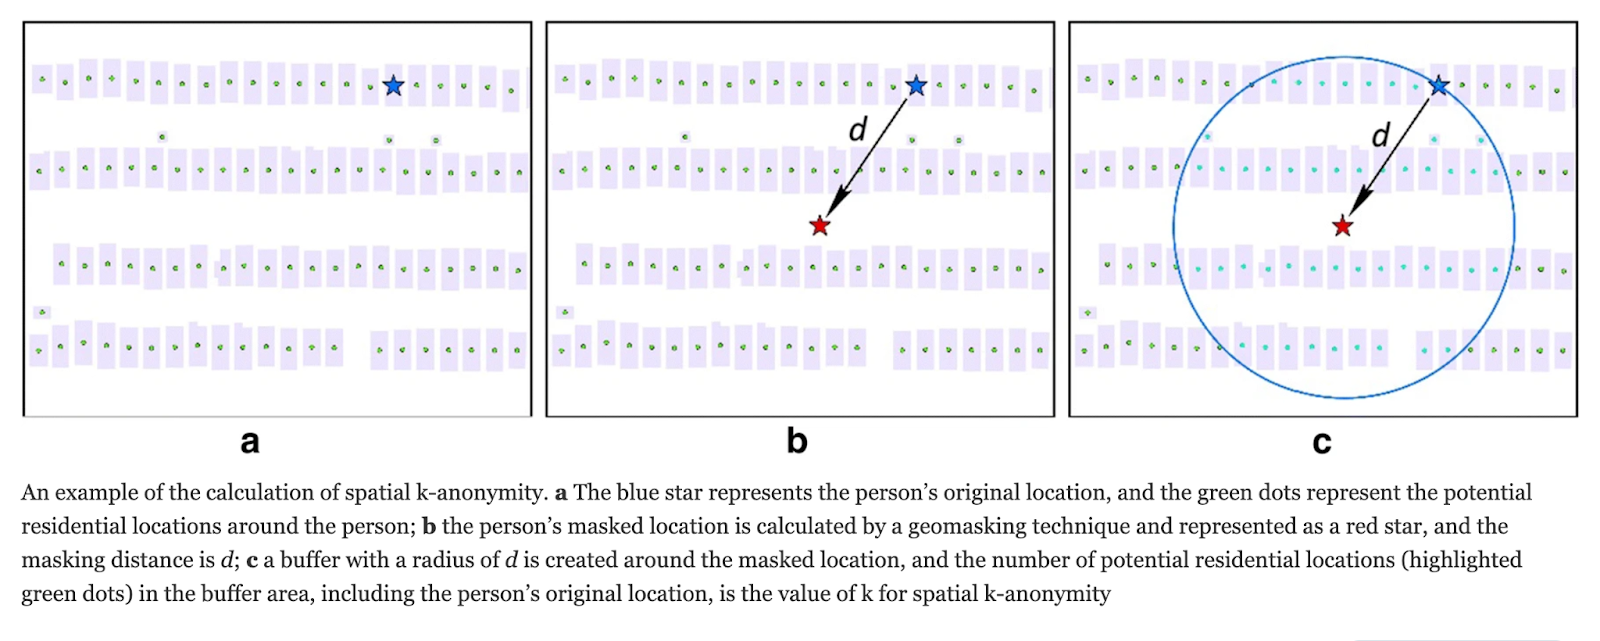
We need a way to quantify the proposed geomasking’s effectiveness; how much have we reduced the risk of re-identification? Spatial k-anonymity is the most widely used method for determining this.
Spatial k-anonymity produces a value "K" which measures the number of potential locations that could be identified as the “true location” of the user after geomasking. With this value, the probability of a bad actor selecting the true location is 1/K. The larger the value of K, the more effective the geomasking is at protecting a user's actual location.
Population density
The population density of a user’s location can have an impact on geomasking’s effectiveness. Consider this extreme case: A user orders from a rural area in which their house is the only one in a square mile. After applying geomasking, a new displaced point might still exist within the boundaries of this square mile. This would mean that a bad actor could easily re-identify the user’s home address.
Instead, we could make local population density inversely proportional to the standard deviation used for our Gaussian distributions. In urban areas, our geomasked points would deviate less than those in rural areas.
The nature of DoorDash’s business means that orders primarily are delivered to suburban or urban areas, making the rural example much less of a concern. Nonetheless, it is an important consideration in any number of other applications.
Estimating k-anonymity
We can estimate the k-anonymity of any given geomasked point by multiplying the local population density by a circular ring approximation of the Gaussian probability distribution as shown in Figure 5.
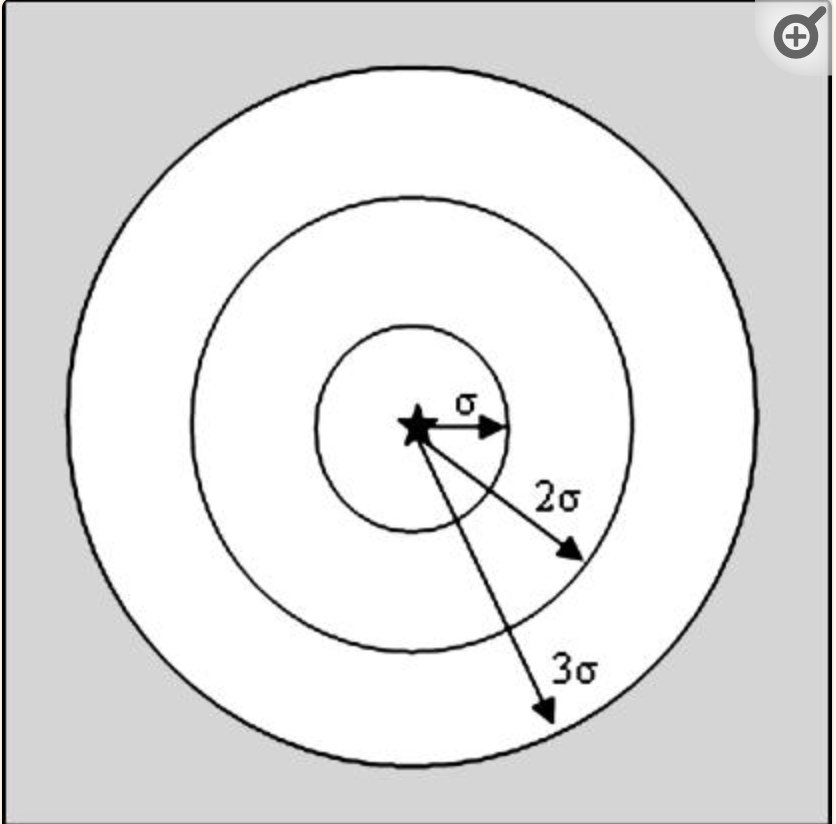
This is inspired by the methodology used in a 2006 paper studying geomasking for epidemiology purposes:
“Since 68.26% of patients should fall, on average, within the first standard deviation, σ miles in radius from where they were originally located, we can multiply the local population density by the area, πσ² and by the probability that the patient would have been moved into that region, 0.6826. We can add to this the next ring's population density multiplied by its area and its probability that a patient would be transplanted into that area, 0.2718. Finally, we can add the area of the last ring multiplied by its local population density by its probability density, 0.0428.”
This description can be modeled as follows:
K = (.6826 * β * A1) + (.2718 * β * A2) + ( .0428 * β * A3)
K: the degree of k-anonymity
β: local population density
σ: standard deviation in Gaussian distribution
A1: the area of the inner circle = πσ²
A2: the area of the middle circle = 4πσ² - πσ²= 3πσ²
A3: the area of the outer circle = 9πσ² - 4πσ² = 5πσ²
As an example, let’s use β = 100 households per sq mi and set σ = .25 mi
This would result in a K of approximately 34 locations from which the true location could be located.
Finding an optimal K value
According to Khaled El Emam in “Protecting Privacy Using K-Anonymity":
“Even though a minimum K value of 3 is often suggested, a common recommendation in practice is to ensure that there are at least five similar observations (K = 5). It is uncommon for data custodians to use values of K above 5, and quite rare that values of K greater than 15 are used in practice.”
Another study on the effectiveness of geomasking on epidemiology data used a value of K = 20 as an indicator of success.
Based on these examples, we propose striving for a K value between 5 and 20.
Tuning to a distribution’s most reasonable standard deviation
Once we set our desired K and have a reasonable approximation of the population density of the subject region, we can reverse-engineer the previous formula to find a reasonable standard deviation to use:
K = ( .6826 * β * A1) + (.2718 * β * A2) + (.0428 * β * A3)
Discerning distance of address displacement
As an example, let’s say we chose a standard deviation of σ = .25 mi. We can then derive how much displacement we can expect following the 68-95-99.7 rule.
| Proportion of Geomasked Points | Maximum Displacement |
| 68% (σ) | .25 mi away from original point |
| 95% (2σ) | .50 mi away from original point |
| 99.7% (3σ) | .75 mi away from original point |
With this displacement, we can expect 99.7% of the displaced points to fall within three-quarters of a mile of the original point.
Conclusion
We have demonstrated an effective approach to obfuscating user address data in order to help prevent re-identification, while still giving sufficient context to be able to analyze the data to improve our platform and provide a better user experience.


 MarcoChirico


